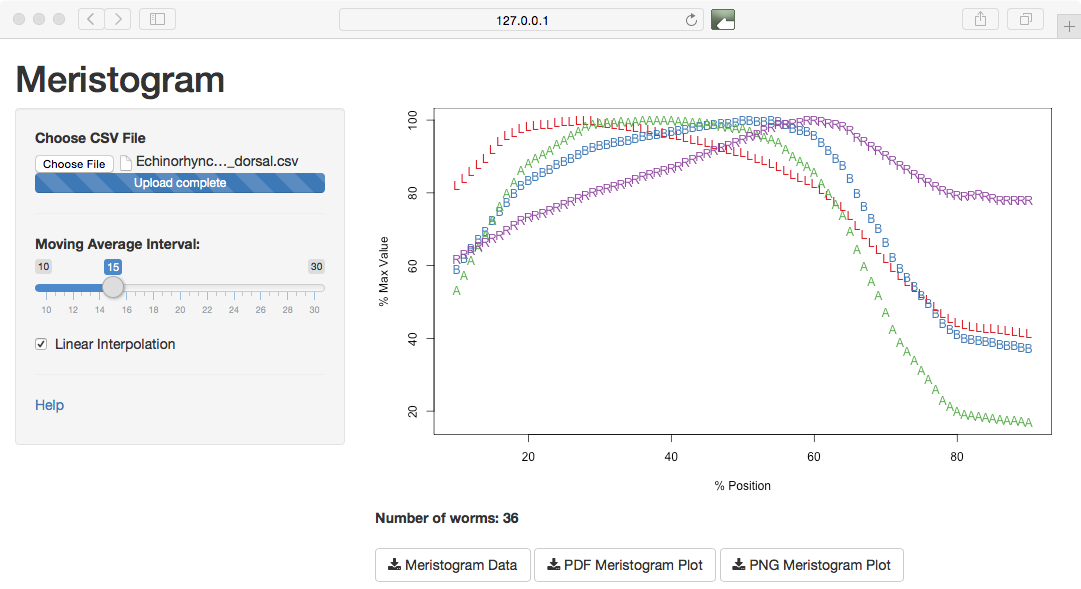
Screen-grab of the graphical user interface to the Meristogram tool. The slider control provides dynamic control of the moving average interval and linear interpolation can be toggled on/off using the checkbox. Plots and data can be downloaded using the buttons at the bottom of the screen.