Scatter plot of genome size (2C-value, pg) values (as given in Table
|
|
||
|
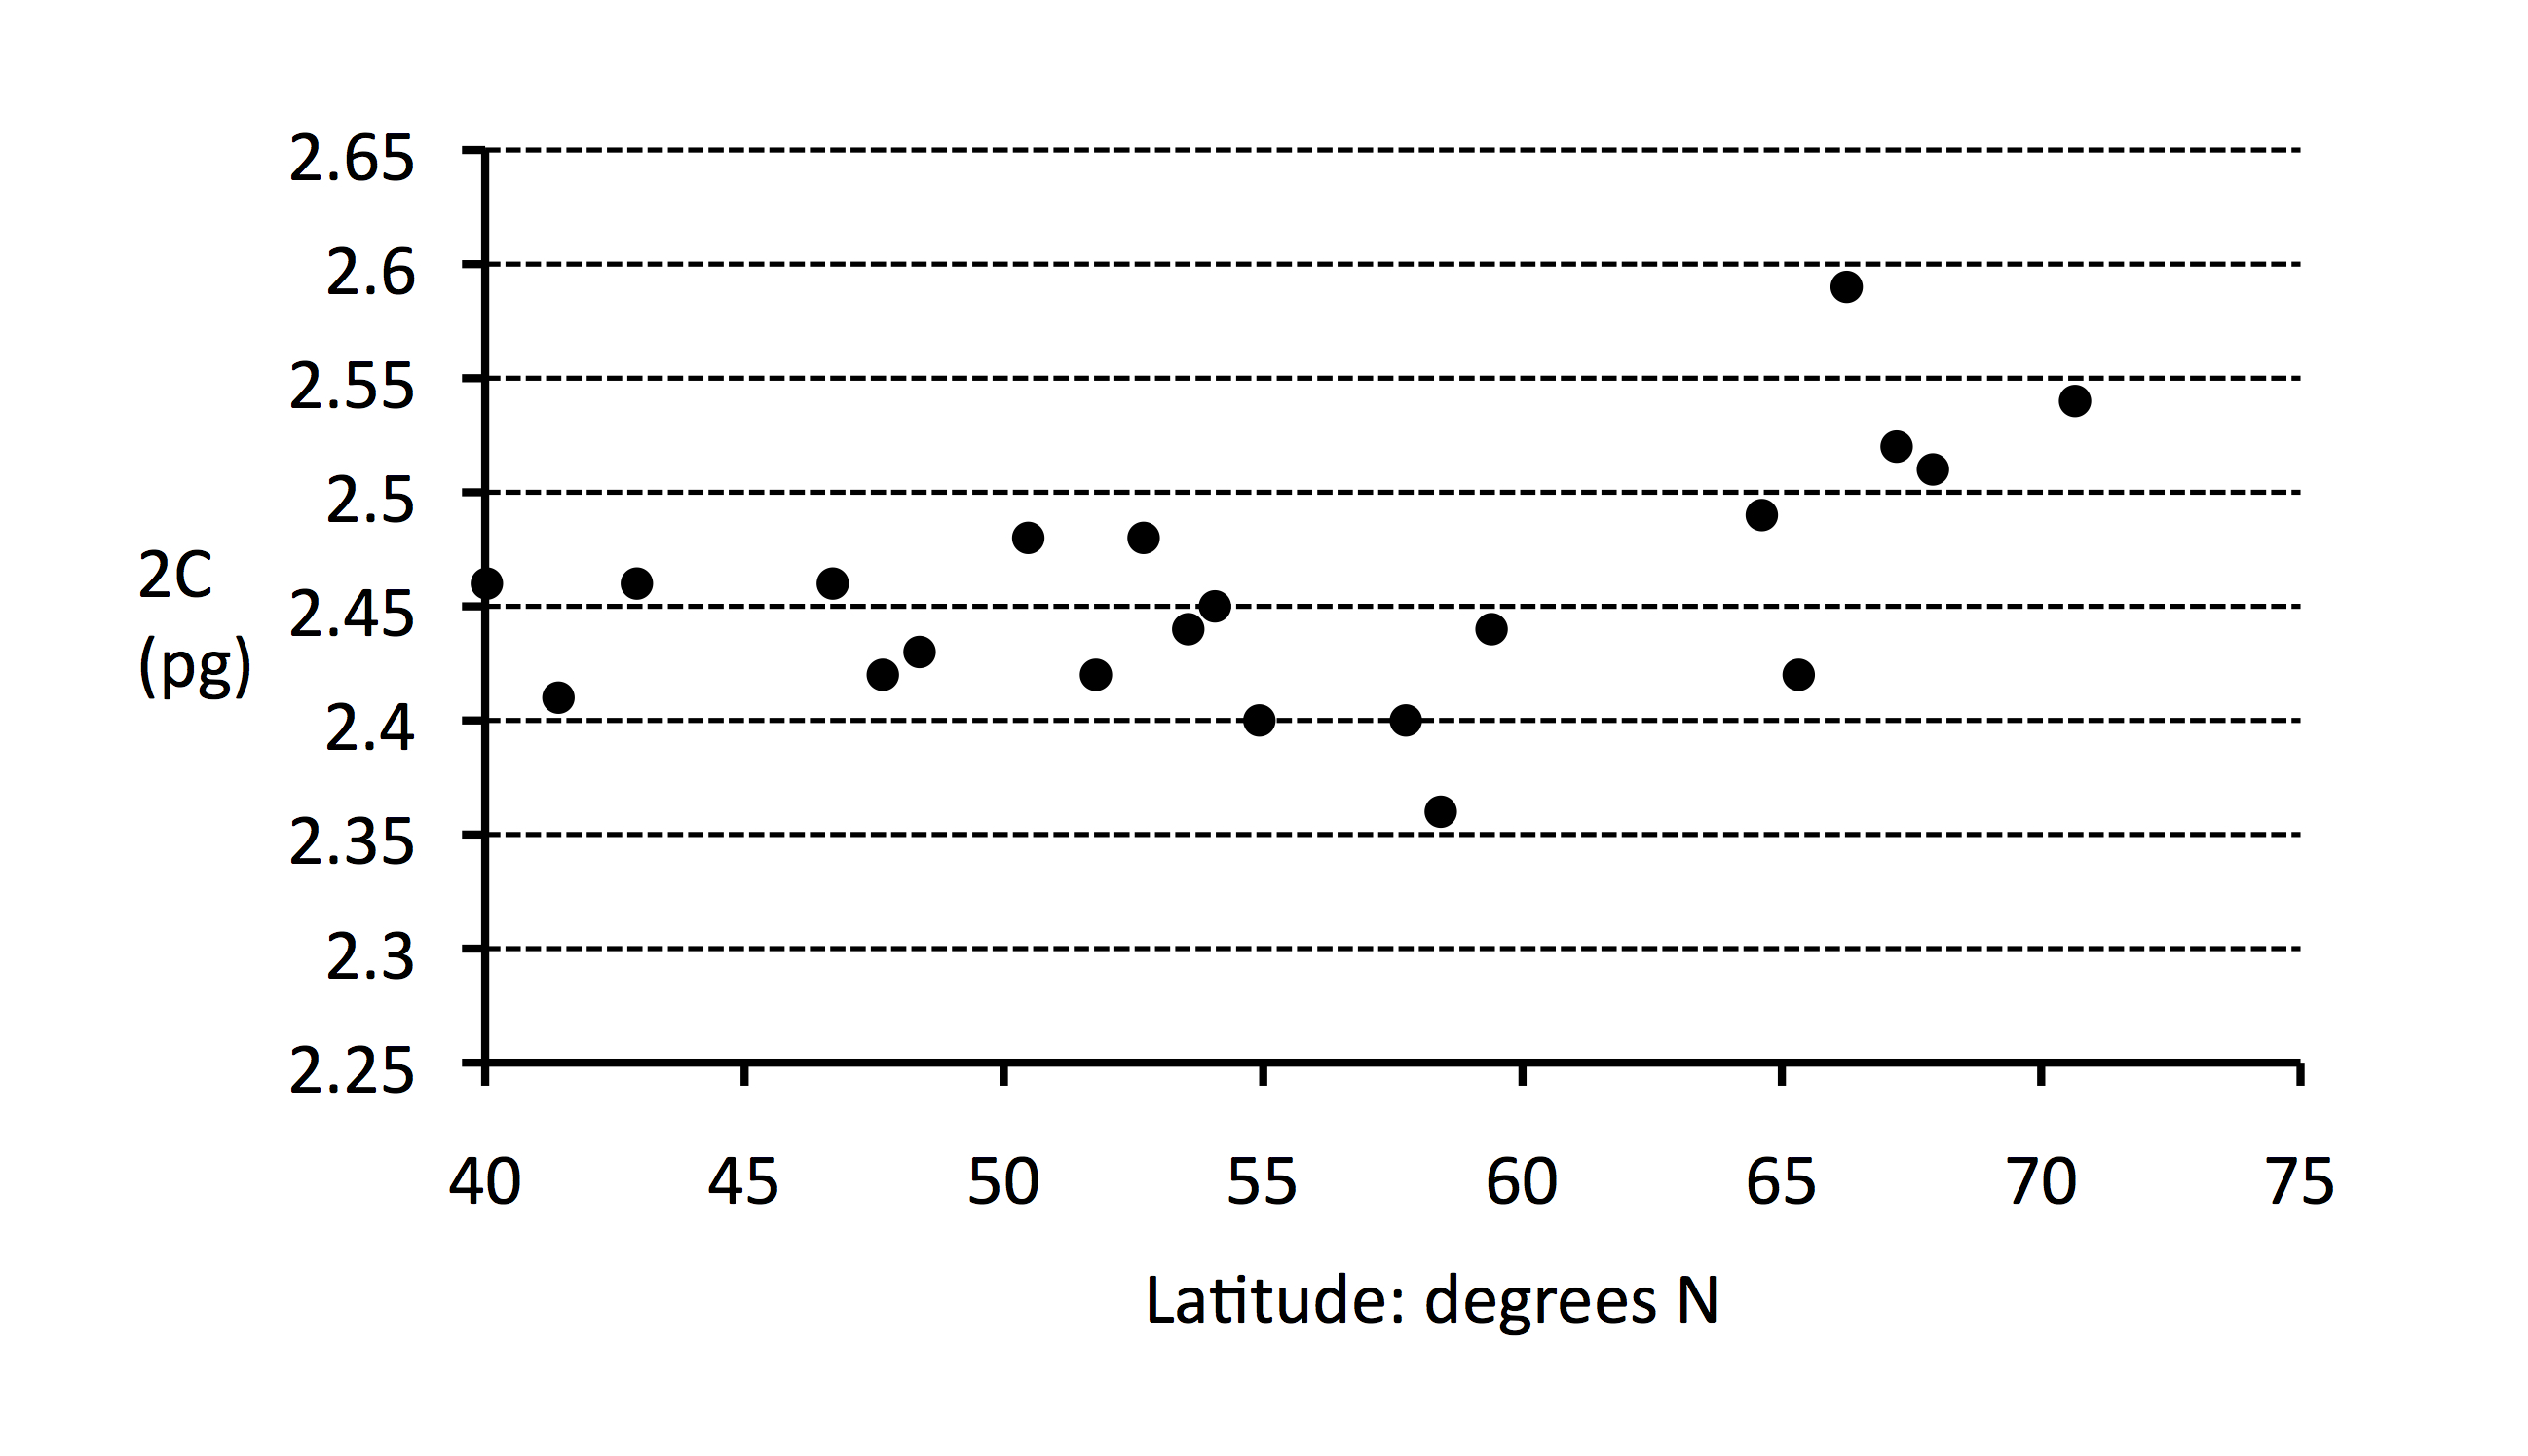
Scatter plot of genome size (2C-value, pg) values (as given in Table |
||
| Part of: Cronk Q, Hidalgo O, Pellicer J, Percy D, Leitch I (2016) Salix transect of Europe: variation in ploidy and genome size in willow-associated common nettle, Urtica dioica L. sens. lat.,from Greece to arctic Norway. Biodiversity Data Journal 4: e10003. https://doi.org/10.3897/BDJ.4.e10003 |