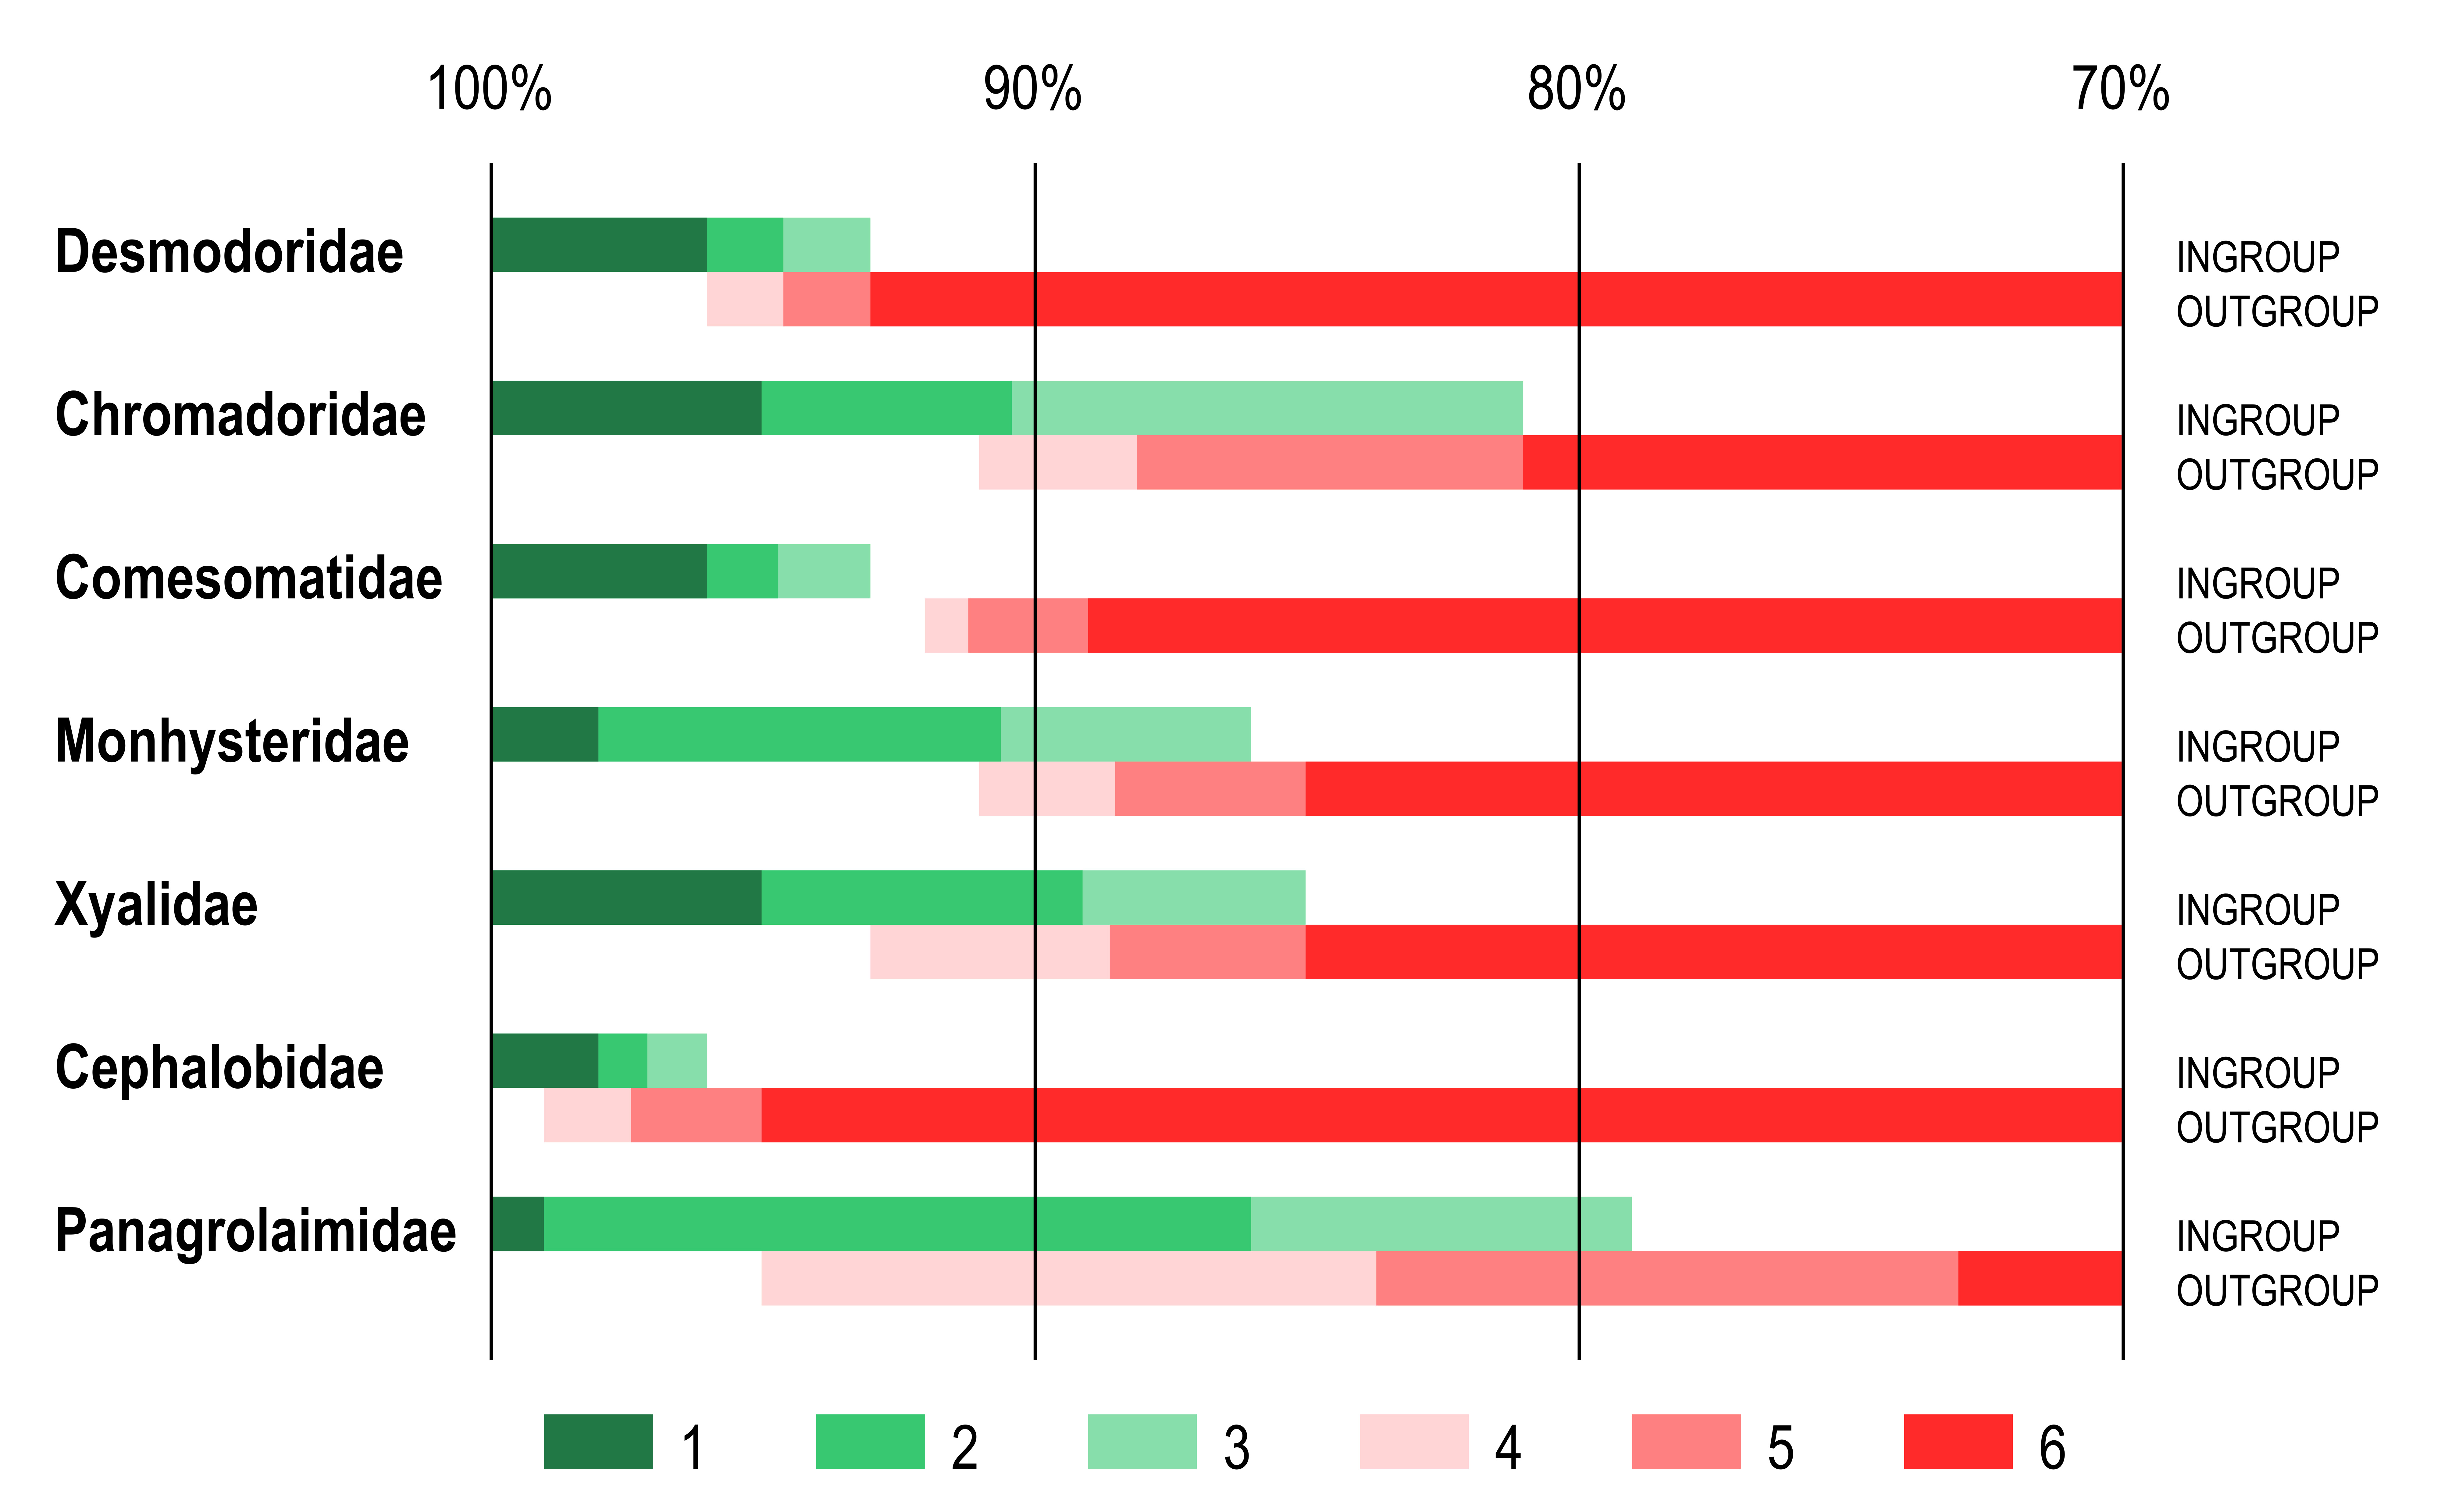
Ranges of identity scores of furthest ingroup taxon and nearest outgroup taxon as revealed by BLAST comparison of query sequences with reference dataset with variable coverage between sequences. Ranges of identity scores. 1 – 100% identity to maximum identity score of the furthest ingroup taxon; 2 – maximum to average identity scores of the furthest ingroup taxon; 3 – average to minimum identity scores of the furthest ingroup taxon; 4 – maximum to average identity scores of the nearest outgroup taxon; 5 – average to minimum identity scores of the nearest outgroup taxon; 6 – minimum identity score of the nearest ingroup taxon to 70% identity threshold.