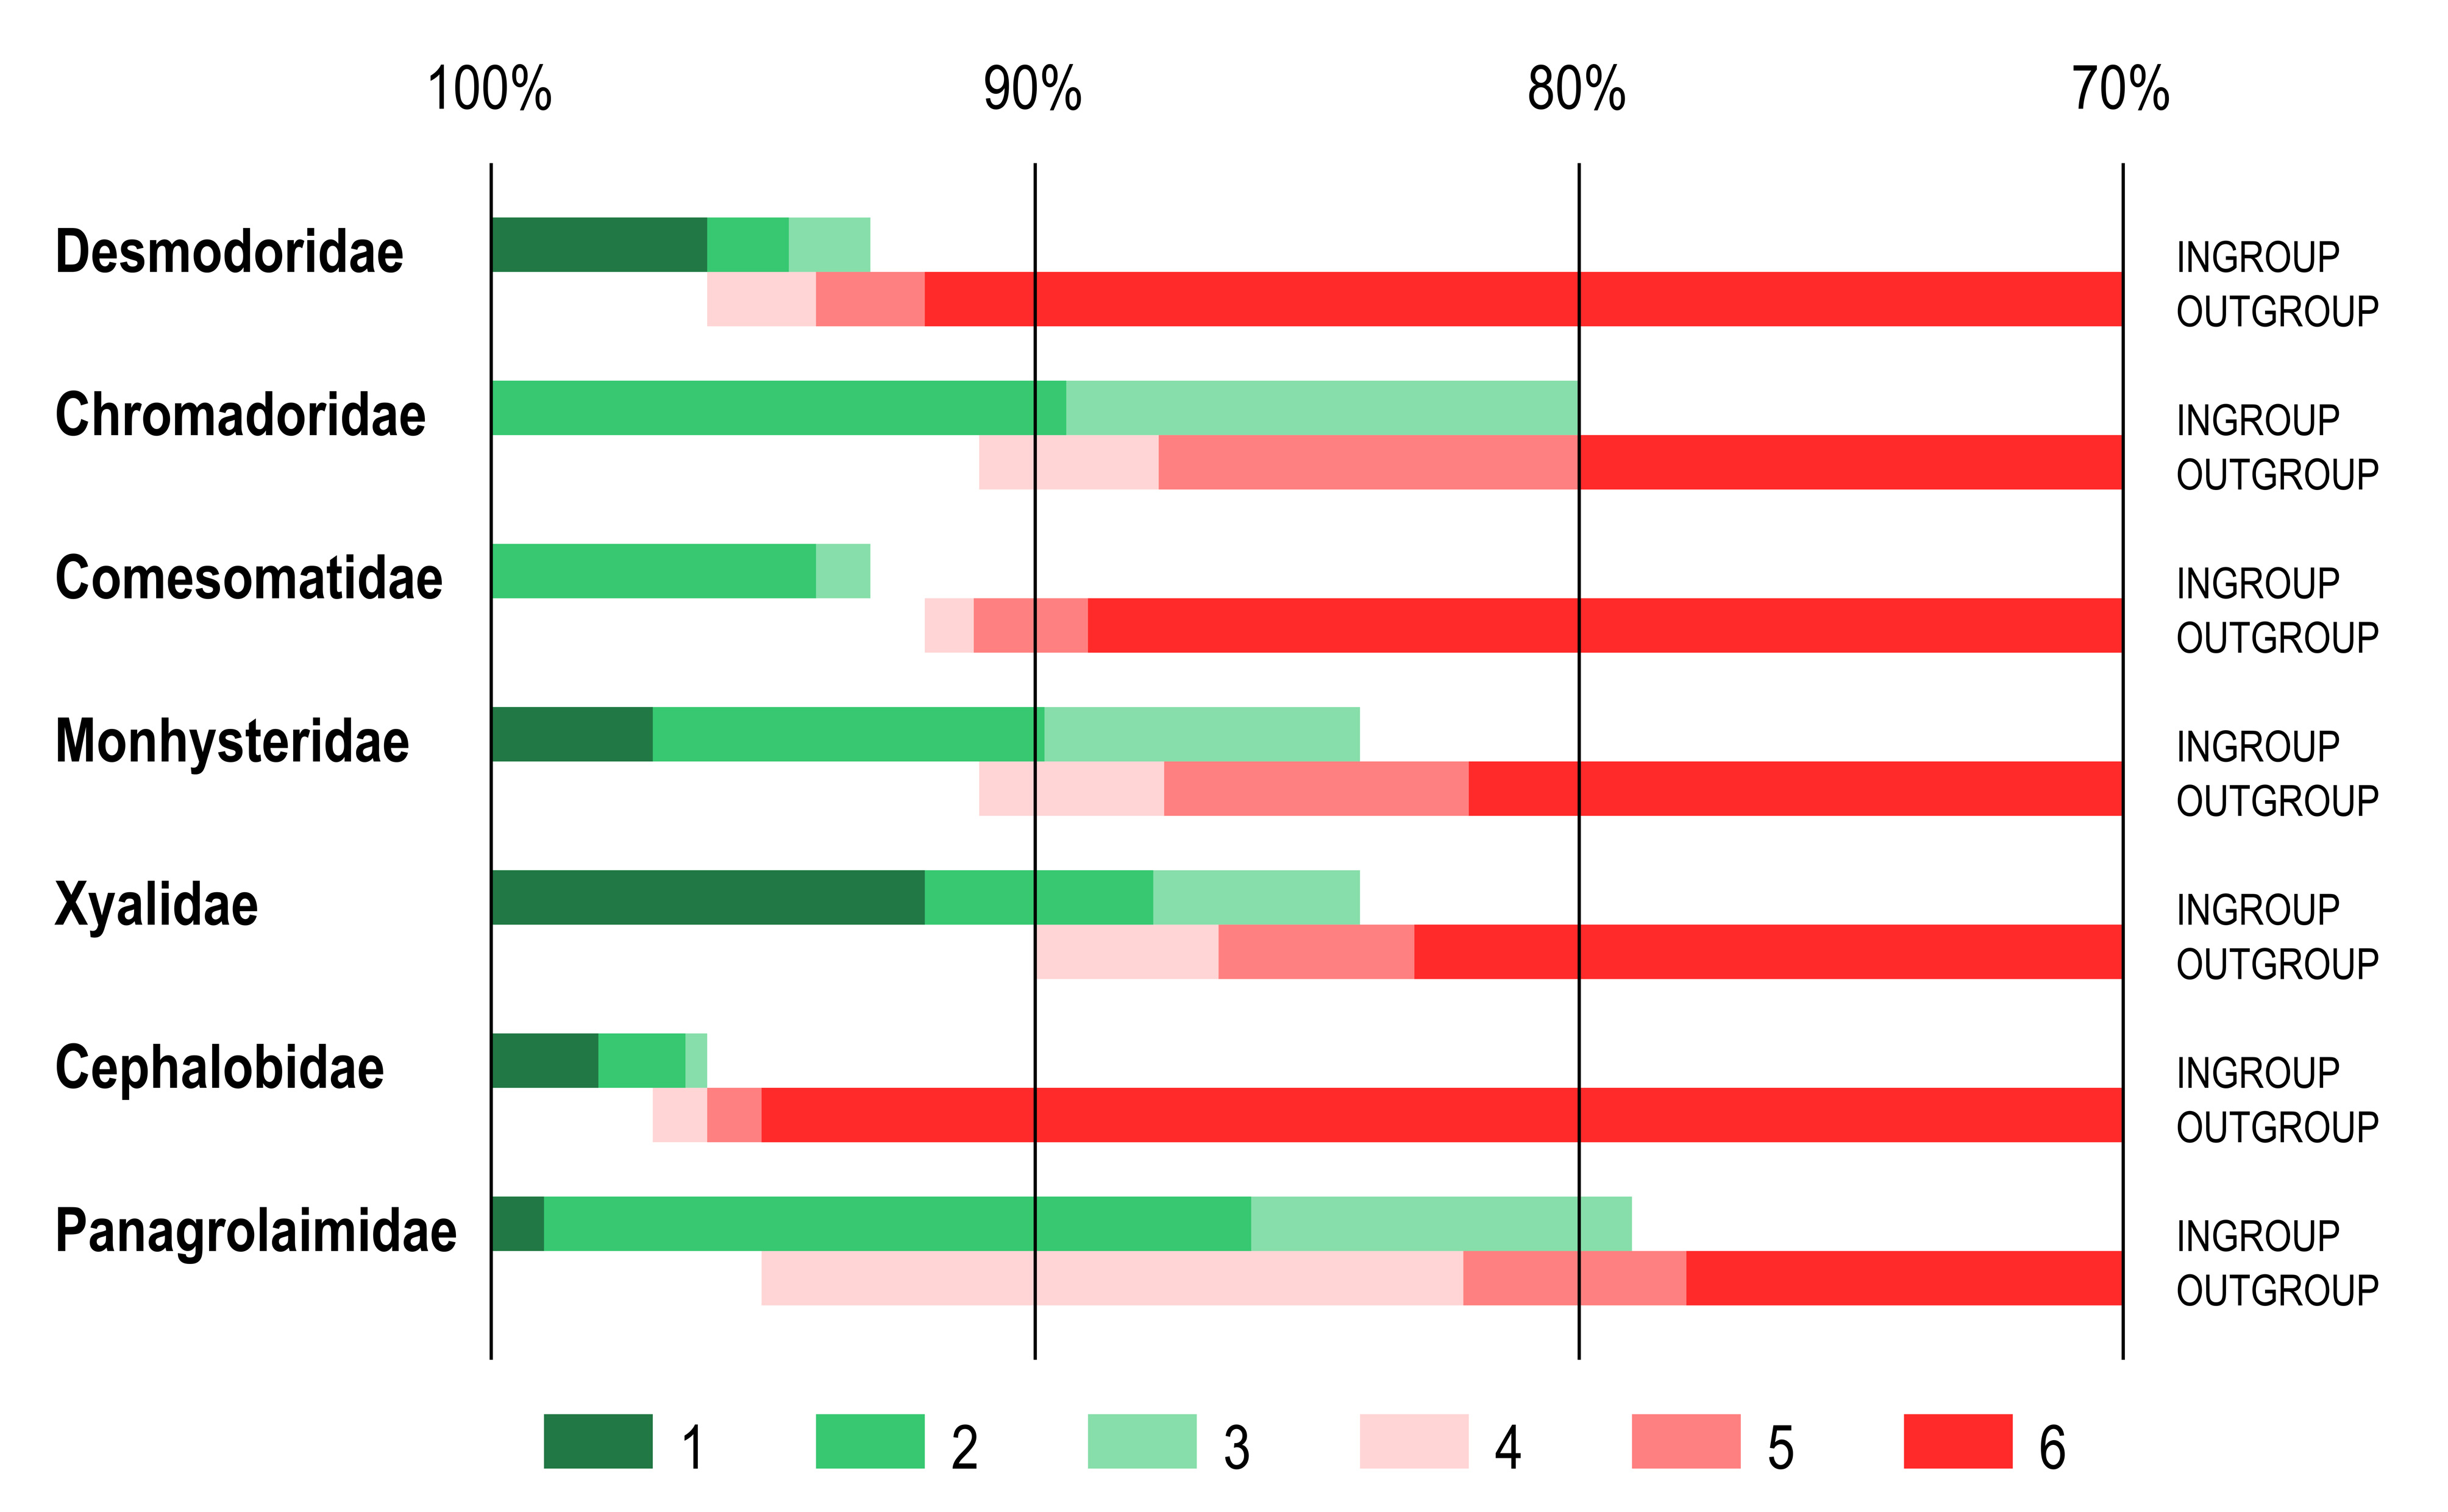
Ranges of identity scores of furthest ingroup taxon and nearest outgroup taxon as revealed by BLAST comparison of query sequences with reference dataset with 100% coverage between sequences. anges of identity scores. 1 – 100% identity to maximum identity score of the furthest ingroup taxon; 2 – maximum to average identity scores of the furthest ingroup taxon; 3 – average to minimum identity scores of the furthest ingroup taxon; 4 – maximum to average identity scores of the nearest outgroup taxon; 5 – average to minimum identity scores of the nearest outgroup taxon; 6 – minimum identity score of the nearest ingroup taxon to 70% identity threshold.