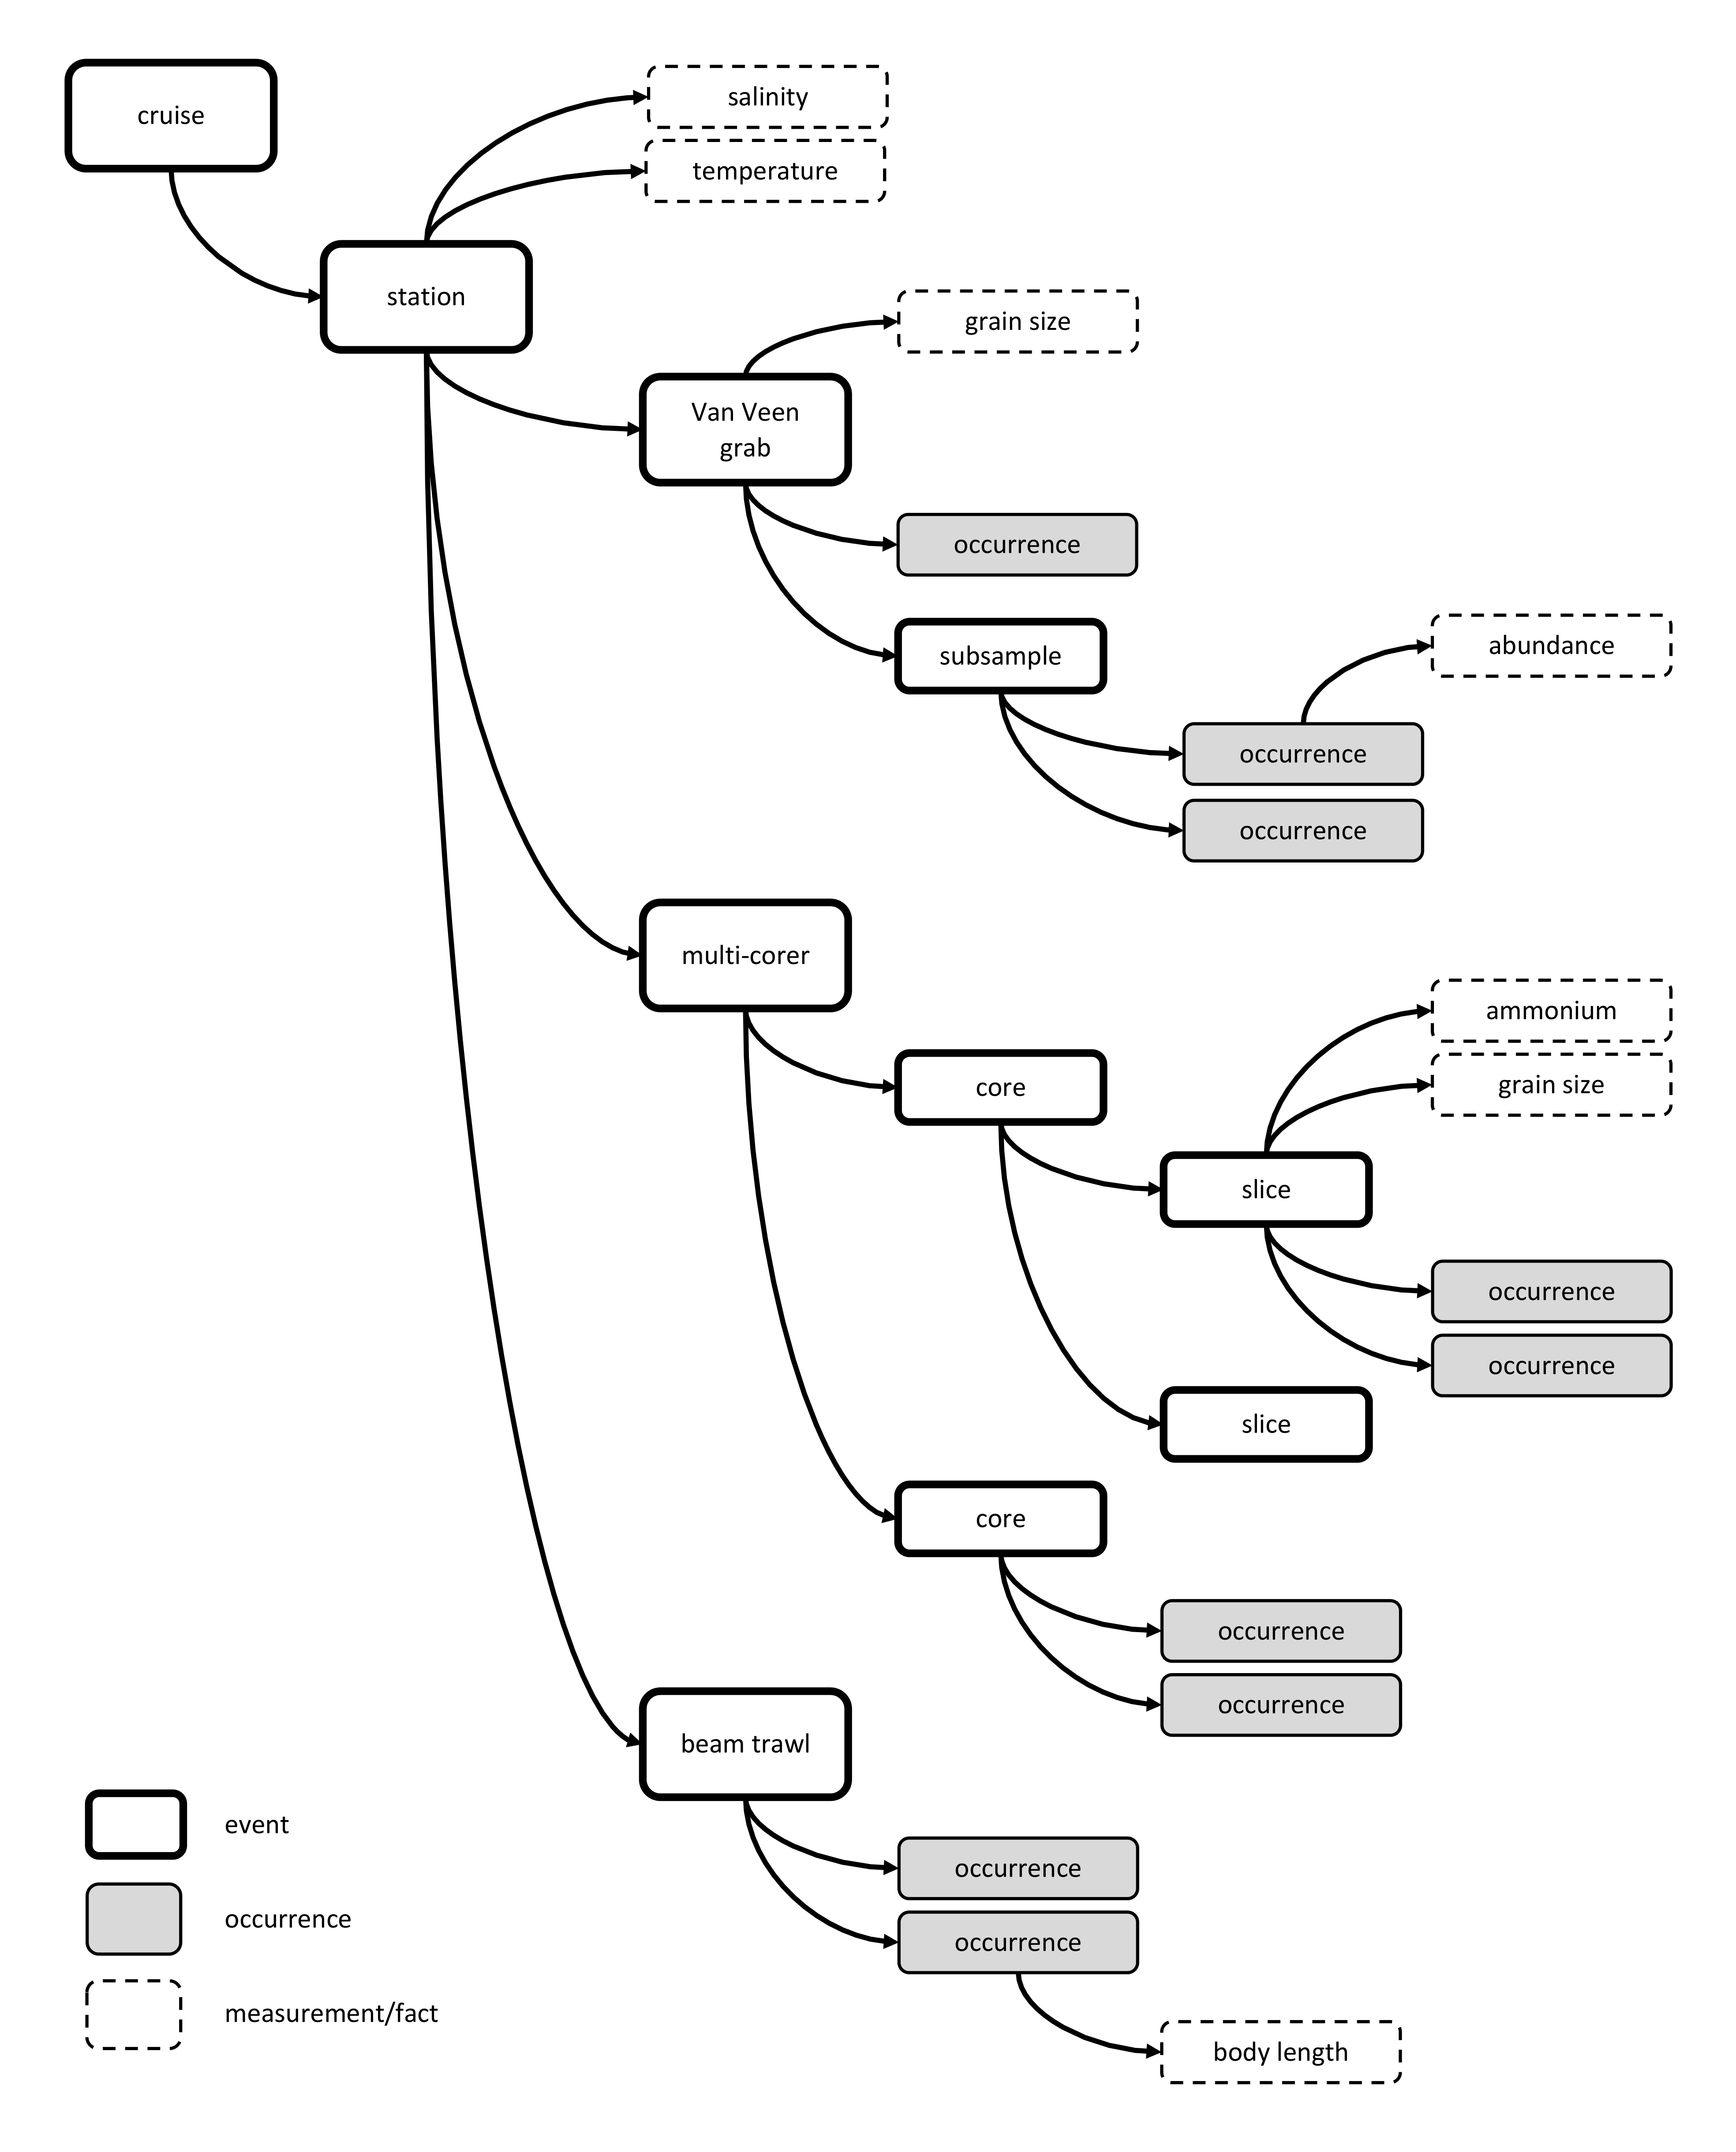
A hypothetical example based on a complicated sequence of sampling events at a given sampling location. In the example the bold rectangles are sampling events, the dashed rectangles measurements or facts, the grey rectangles are occurrences. The arrows between the rectangles illustrate the (hierarchical) relations between the different sampling events and between events and their associated occurrences and measurements. The example shows data sampled using a Van Veen grab, a beam trawl, and a multi-corer. The macrobenthos analysis was based on the complete Van Veen grab sample, while the meiofauna analysis was based on subsamples. The multicore sample was divided into different depth slices. Likewise, an abiotic measurement can refer to the entire sample or to a subsample.