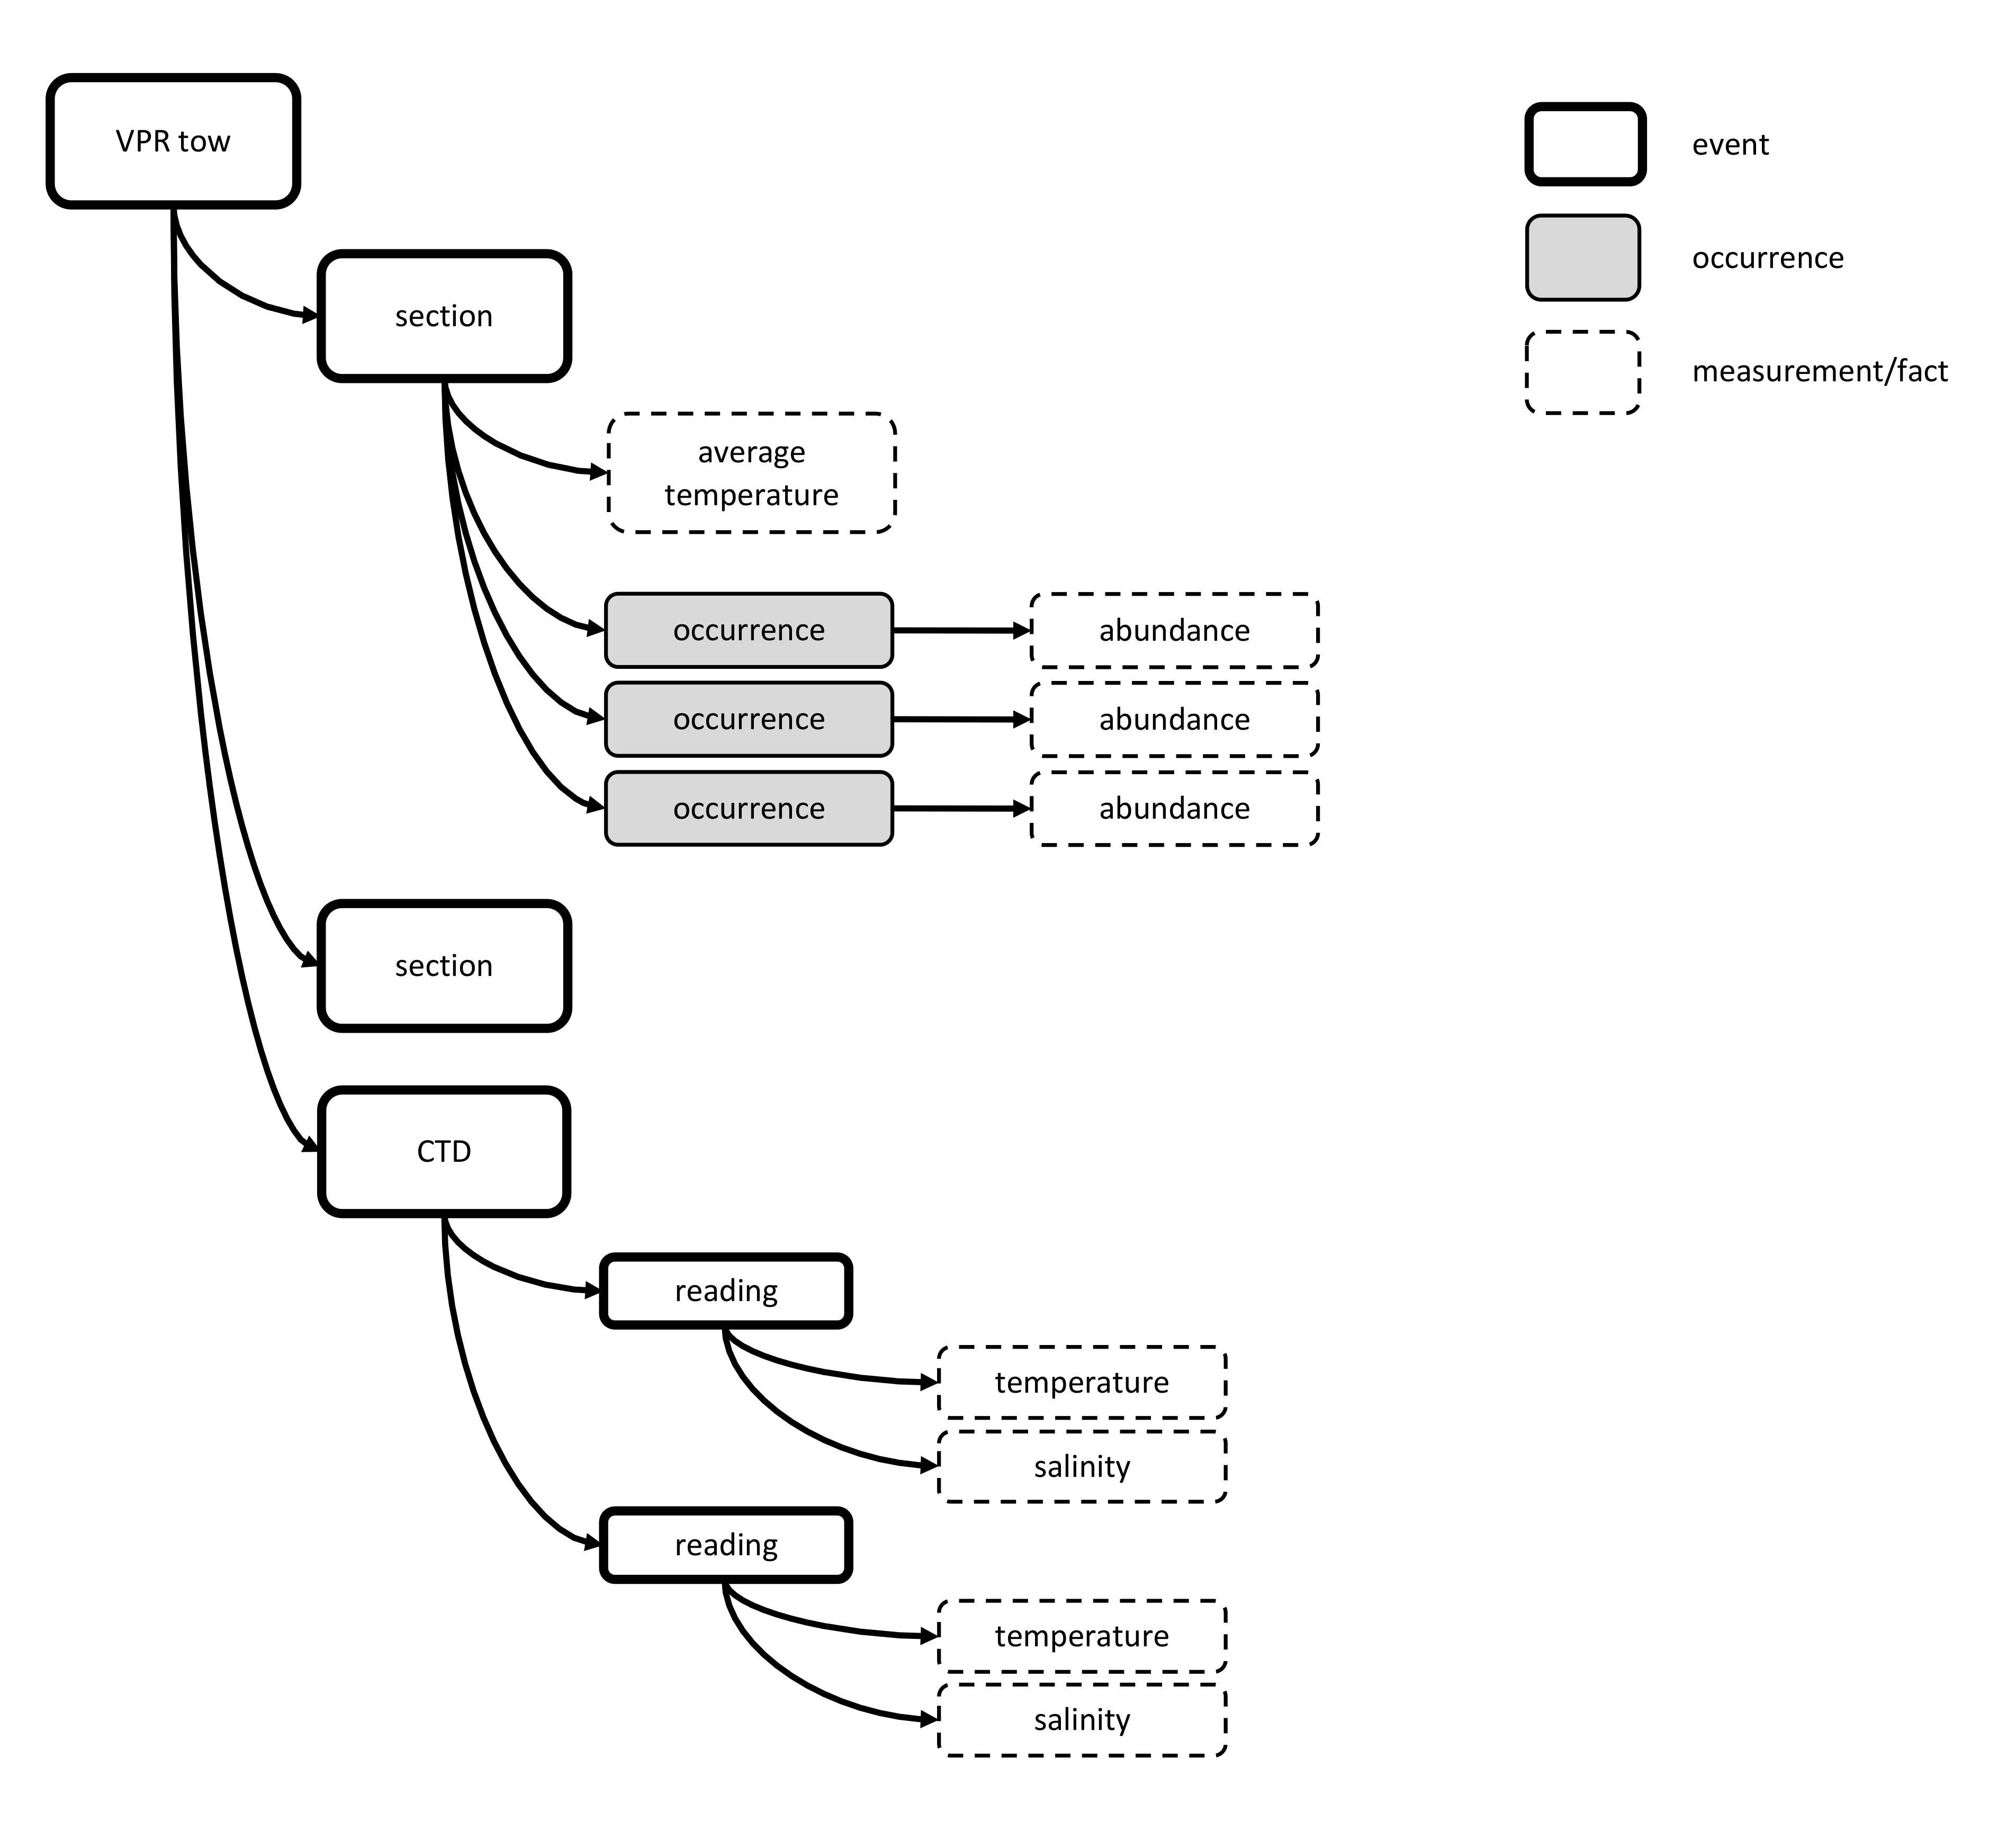
A schematic presentation showing how VPR data collected together with a CTD sensor can be stored using Option 6. In the example the bold rectangles are sampling events, the dashed rectangles measurements or facts, the grey rectangles are occurrences. Software can group the occurrences from all images taken in a defined interval into a "section" event. Derived abiotic data (like average temperature) from a sensor can be linked to this interval. Additionally - if preferred - the raw CDT data can be stored as a seperate child event "CTD" of the VPR tow (as shown in this figure).