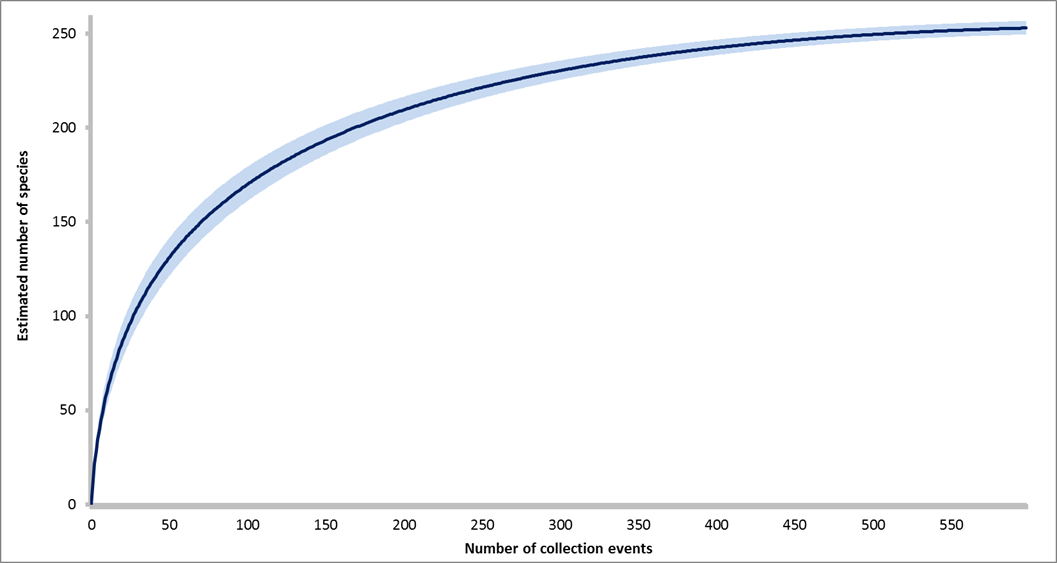
Species accumulation curve generated for bee species sampled in 558 collection events between 2013 and 2015. Species estimates were generated using EstimateS. The blue line represents the mean species accumulation, and the light blue shaded area represents the upper and lower bound of 95% confidence interval for species estimate.