|
Biodiversity Data Journal :
Research Article
|
|
Corresponding author:
Academic editor: Vlada Peneva
Received: 27 Jul 2016 | Accepted: 15 Sep 2016 | Published: 21 Sep 2016
© 2016 Oleksandr Holovachov
This is an open access article distributed under the terms of the Creative Commons Attribution License (CC BY 4.0), which permits unrestricted use, distribution, and reproduction in any medium, provided the original author and source are credited.
Citation:
Holovachov O (2016) Metabarcoding of marine nematodes – evaluation of reference datasets used in tree-based taxonomy assignment approach. Biodiversity Data Journal 4: e10021. https://doi.org/10.3897/BDJ.4.e10021
|
|
Abstract
Background
Metabarcoding is becoming a common tool used to assess and compare diversity of organisms in environmental samples. Identification of OTUs is one of the critical steps in the process and several taxonomy assignment methods were proposed to accomplish this task. This publication evaluates the quality of reference datasets, alongside with several alignment and phylogeny inference methods used in one of the taxonomy assignment methods, called tree-based approach. This approach assigns anonymous OTUs to taxonomic categories based on relative placements of OTUs and reference sequences on the cladogram and support that these placements receive.
New information
In tree-based taxonomy assignment approach, reliable identification of anonymous OTUs is based on their placement in monophyletic and highly supported clades together with identified reference taxa. Therefore, it requires high quality reference dataset to be used. Resolution of phylogenetic trees is strongly affected by the presence of erroneous sequences as well as alignment and phylogeny inference methods used in the process. Two preparation steps are essential for the successful application of tree-based taxonomy assignment approach.
- Curated collections of genetic information do include erroneous sequences. These sequences have detrimental effect on the resolution of cladograms used in tree-based approach. They must be identified and excluded from the reference dataset beforehand.
- Various combinations of multiple sequence alignment and phylogeny inference methods provide cladograms with different topology and bootstrap support. These combinations of methods need to be tested in order to determine the one that gives highest resolution for the particular reference dataset.
Completing the above mentioned preparation steps is expected to decrease the number of unassigned OTUs and thus improve the results of the tree-based taxonomy assignment approach.
Keywords
Nematoda, metabarcoding, alignment, phylogeny inference, taxonomy assignment, 18S rRNA, OTU, tree-based approach.
Introduction
Metabarcoding of living organisms is on the rise as the cost of Next Generation Sequencing goes down and processing pipelines improve (
Tree-based taxonomy assignment approach (called phylogenetic approach in
There are several issues that needs to be considered when applying tree-based taxonomy assignment approach. First is the size and properties of the barcoding region. Most of the barcoding regions used in the past range in size between 250 and 700 bases and are expected to include fewer phylogenetically informative sites comparing to loci normally used for phylogenetic analysis (for example 1600-1800 bases long 18S rRNA). Barcoding regions are purposely chosen to include hypervariable sites (
As will be discussed in detail elsewhere (Holovachov et al. unpublished), if OTUs of marine nematodes can not be identified to species or even genus level due to incompleteness of reference databases, the largest taxon that they can be placed into, and that can still provide sufficient information for ecological studies is the family. However, before using tree-based approach to assign OTUs of marine nematodes to the families, (Holovachov et al. unpublished), its possible drawbacks must be thoroughly evaluated. Such as the impact of the reference dataset, or the alignment or phylogeny inference algorithms on the quality of the results.
The goal of this paper is to estimate how well the cladogram based solely on the barcoding region (in this case it is the 5' end of 18S rRNA molecule) resolves and supports families of marine nematodes. It will be accomplished by evaluating the results obtained by analyzing several reference datasets and by using different combinations of alignment and phylogeny inference algorithms. The first dataset will include all relevant sequences that fulfill specific criteria described below; the second dataset will exclude all sequences that are found to be questionable; the third dataset will also exclude all sequences that do not have sufficient coverage with the barcoding region used in Haenel et al. (unpublished) and Holovachov et al. (unpublished).
Materials and Methods
1. Sequence data
SILVA database (
- For the same species, longer sequences were chosen over shorter sequences.
- Taxa identified to species level were chosen over taxa identified only to the genus level, considering that they both belong to the same genus.
- All fully identified species for each genus were included.
- For the same species (if available) no more than two sequences were included.
- All available genera for every family of marine nematodes were included.
- All families with at least two representative species were included.
- All sequences that were missing 40 bases and more on the 5' end (equal to about 10% of of the length of the barcoding region) were excluded.
Suppl. material
- Complete dataset included all selected sequences.
- "Filtered" dataset excludes species that are likely incorrectly identified and therefore consistently had negative impact on tree topology and clade support in the first analysis of the complete dataset.
- "Long" dataset included only those sequences that had the same length as barcoding region (see section 2 of Materials and Methods, below), or were missing no more than 10 bases on the 5' end.
As a result, complete dataset includes 284 terminal taxa (280 nematode sequences and four outgroup taxa) belonging to 50 families or superfamilies (superfamilies Dorylaimoidea and Mononchoidea will be treated as whole, without subdivision into separate families in subsequent analyses). "Filtered" dataset was created by removing all erroneous sequences from the complete dataset. It includes 276 taxa (272 nematode sequences and four outgroup taxa) belonging to 50 nematode families. "Long" dataset was created based on the "filtered" dataset by removing sequences that had insufficient coverage. It includes 212 taxa (208 nematode sequences and four outgroup taxa) belonging to 48 nematode families or superfamilies. Families Anticomidae and Phanodermatidae are not presented in the "long" dataset because only one species of Anticomidae and none of Phanodermatidae satisfied the requirement of sufficient sequence length.
2. Barcoding region
This publication evaluates the barcoding region of the 18S rRNA gene that includes V1 and V2 variable regions (Fig.
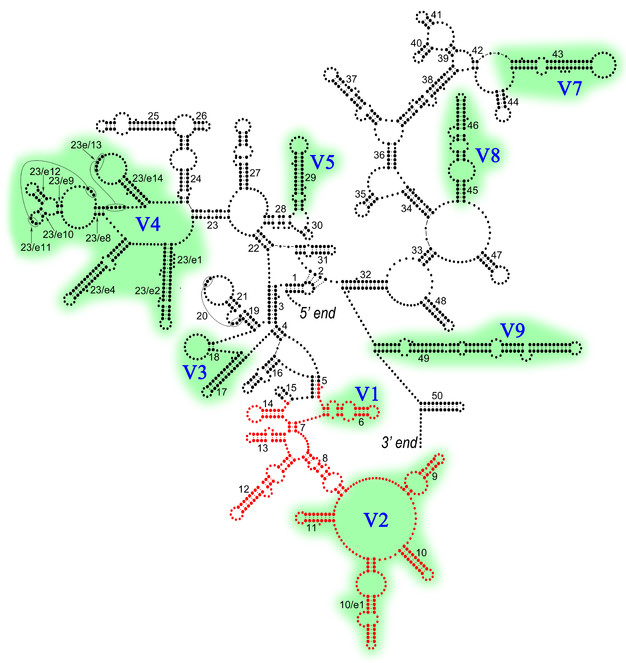
Barcoding region marked in red on the generalized secondary structure model of the nematode 18S rRNA (modified from
3. Alignment
When applied to nematodes, following tools were used to align anonymous OTUs with reference datasets: Clustal-W/X (
Six different alignment algorithms were tested: Clustal-O (
4. Phylogeny inference
Previously published studies on nematode barcoding or metabarcoding used Neighbor joining (
Neighbor joining trees were inferred using MEGA ver. 6 or 7 (
Halicryptus spinulosus sequence (AF342790) was used to root all phylogenetic trees. Monophyletic clades with bootstrap support of 70% and higher were considered well supported and fully resolved. Trees were visualized using FigTree (
5. Evaluation criteria
As discussed in the Introduction, only anonymous OTUs placed within monophyletic and highly supported clades can be identified with confidence. Namely, OTUs that cluster within monophyletic clades with high bootstrap support are assigned certain taxonomic status (identification), e.g. barcodes clustered within the clade that is equivalent to a family "A" or a genus "B" in the classification may be identified as belonging to that family "A" or genus "B". On the other hand, anonymous OTUs clustered outside well supported monophyletic clades should be treated as unassigned. Therefore, following criteria were used to evaluate the quality of the results of each individual analysis (cladogram) produced in this study:
- Number of nematode families resolved as monophyletic, paraphyletic or polyphyletic in each analysis. The therm "family" will be used to describe clades that are equivalent to family-level categories in nematode classification.
- Bootstrap support that each monophyletic clade receives. Fully resolved clades, or families, are those that receive ≥70% bootstrap support.
It is expected that monophyletic clades with high bootstrap support are likely to remain such after combining the reference dataset with anonymous OTUs in possible future studies. To confirm this, and for the final comparison, two scenarios were chosen, the "worst case" (combination of dataset, alignment and phylogeny inference algorithms that produced the lowest number of highly supported monophyletic clades equivalent to families) and the "best case" (same but highest number of highly supported monophyletic clades equivalent to families). 25 pre-selected sequences (see Results, sections 4 and 5) were added to both alignments to create new datasets, both were re-aligned and re-analyzed following same "worst case" and "best case" settings. These pre-selected sequences represent species, which were either not included in the original complete dataset because of the criterium #2 (taxa identified to species level were chosen over taxa identified only to the genus level, considering that they both belong to the same genus); #4 (for the same species no more than two sequences were included); or because these sequences are available from GenBank but not yet included in the SILVA database. They were chosen to represent both well and poorly resolved families.
Results
1.1. Complete dataset, Neighbor joining analysis
Cladograms inferred using Neighbor joining algorithm and six different types of alignment (Suppl. materials
Number of nematode families resolved as monophyletic and with high (≥70%) bootstrap support for all combinations of sequence dataset, alignment and phylogeny inference algorithms.
|
Dataset (number of families) |
Phylogeny inference |
Alignment |
|||||
|
Clustal-O |
Clustal-W |
MAFFT |
MUSCLE |
PRANK |
SILVA |
||
|
Complete (50 families) |
Neighbor joining |
22 |
24 |
24 |
23 |
24 |
23 |
|
Complete (50 families) |
Maximum likelihood |
21 |
24 |
24 |
21 |
26 |
21 |
|
"Filtered" (50 families) |
Neighbor joining |
27 |
29 |
29 |
30 |
29 |
29 |
|
"Filtered" (50 families) |
Maximum likelihood |
28 |
32 |
28 |
28 |
31 |
26 |
|
"Long" (48 families) |
Neighbor joining |
32 |
34 |
34 |
33 |
35 |
32 |
|
"Long" (48 families) |
Maximum likelihood |
29 |
33 |
32 |
30 |
36 |
30 |
- Out of 50 nematode families and superfamilies included in this dataset, only 21 families are fully resolved as monophyletic and receive high bootstrap support (≥70%) in all six analyses.
- Three families (Aphanolaimidae, Ceramonematidae and Chromadoridae) are also resolved as monophyletic, but their bootstrap support varies greatly between analyses, from the highest 94-96% to the lowest 43-60%.
- The family Draconematidae is always resolved as monophyletic but with very low bootstrap support (35-66%).
- Three families (Xyalidae, Tobrilidae and Phanodermatidae) may either have very low bootstrap support, or can be resolved as paraphyletic or polyphyletic.
- Five families are consistently resolved as paraphyletic: the family Monhysteridae includes families Xyalidae and Sphaerolaimidae as ingroup clades; the family Desmodoridae is paraphyletic in relation to the family Draconematidae; the family Mermithidae is paraphyletic in relation to the superfamily Mononchoidea; the family Enoplidae consistently includes Anticoma sp. (AY692344) from the family Anticomidae; the clade that includes all members of the family Thoracostomopsidae also includes three unrelated taxa, namely Parodontophora sp. (AM234630) from the family Axonolaimidae, Oncholaimus sp. (KF591739) from the family Oncholaimidae and Gammanema sp. (KF591723) from the family Selachinematidae.
- Seventeen families are always resolved as polyphyletic. Of these, only five families are consistently divided into two or three monophyletic and highly supported clades: the genus Terschellingia is always placed separately from the rest of Linchomoeidae; the genus Prodesmodora is consistently separated from the rest of Microlaimidae; the family Trefusiidae is always divided into terrestrial (Trischistoma and Tripylina) and marine (Trefusia and Rhabdocoma) clades; the family Oxystominidae is always split into three individual clades equivalent to the genera Halalaimus, Oxystomina and Thalassoalaimus+Litinium; the genus Syringolaimus is always placed separately from the rest of Ironidae; the family Anoplostomatidae is always split into clades represented by the genera Anoplostoma and Chaetonema. Two members of the family Diplopeltidae never form a monophyletic clade. Members of the families Oncholaimidae and Enchelidiidae are "mixed" in random manner. Paraphyly of other families is usually caused by separate placement of one or more of the sequences in the cladogram (see Results, section 1.3).
1.2. Complete dataset, Maximum likelihood analysis
The results were more variable between different alignments comparing to Neighbor joining analyses of the same set of data, with PRANK-based analysis resolving the maximum of 26 families, while Clustal-O, MUSCLE and SILVA-based analyses resolving only 21 each (Table
- Out of 50 nematode families and superfamilies included in this dataset, only 18 families are fully resolved as monophyletic and receive high bootstrap support (≥70%) in all six analyses.
- Five families (Xyalidae, Mononchoidea, Mermithidae, Enoplidae and Leptosomatidae) are also resolved as monophyletic, but their bootstrap support varies greatly between analyses, from the highest 72-90% to the lowest 44-65%.
- Nine families (Plectidae, Aphanolaimidae, Camacolaimidae, Ceramonematidae, Draconematidae, Chromadoridae, Tobrilidae, Enchelidiidae, Phanodermatidae) may either have very low to very high bootstrap support, or can be resolved as paraphyletic or polyphyletic.
- Four familes are consistently resolved as paraphyletic: the family Monhysteridae includes families Xyalidae and Sphaerolaimidae as ingroup clades; the family Desmodoridae is paraphyletic in relation to the family Draconematidae; the clade that includes all members of the family Thoracostomopsidae also includes three unrelated taxa, namely Parodontophora sp. (AM234630) from the family Axonolaimidae, Oncholaimus sp. (KF591739) from the family Oncholaimidae and Gammanema sp. (KF591723) from the family Selachinematidae; the family Oxystominidae is a paraphyletic "grade" that includes as one of its monophyletic clades a range of other taxa.
- Fourteen families are always resolved as polyphyletic. Of these, five families are consistently divided into two monophyletic and highly supported clades in exactly the same way as in previous (Neighbor joining) analysis (see Results, section 1.1). Two members of the family Diplopeltidae never form a monophyletic clade. Paraphyly of other families is usually caused by separate placement of one or more of the sequences on the cladogram (see Results, section 1.3).
1.3. Complete dataset, summary
Several sequences were consistently clustered outside their family clades and are thus considered problematic: Anticoma sp. (AY692344), Parodontophora sp. (AM234630), Oncholaimus sp. (KF591739), Gammanema sp. (KF591723), Cyatholaimus sp. (JN968214), Longicyatholaimus sp. (LK054720), Pomponema sp. (KF591743) and Monoposthia costata (AY854221). Visual examination of the alignment with congeneric taxa confirmed that the identity of these sequences is likely to be incorrect. Therefore, these sequences were excluded from the "filtered" dataset.
2.1. "Filtered" dataset, Neighbor joining analysis
Similar to 1.1, all six alignments produced comparable results (Suppl. materials
- Out of 50 nematode families included in this dataset, 27 families are fully resolved as monophyletic and receive high bootstrap support (≥70%) in all six analyses.
- Five families (Aphanolaimidae, Ceramonematidae, Draconematidae, Selachinematidae and Tobrilidae) are also resolved as monophyletic, but their bootstrap support varies greatly between analyses, from the highest 44-94% to the lowest 19-68%.
- Three families (Axonolaimidae, Xyalidae and Phanodermatidae) may either have very low to high bootstrap support, or can be resolved as paraphyletic or polyphyletic.
- Two families (Camacolaimidae and Oxystominidae) are inconsistently resolved as either paraphyletic or polyphyletic.
- Three familes are consistently resolved as paraphyletic: the family Monhysteridae includes families Xyalidae and Sphaerolaimidae as ingroup clades; the family Desmodoridae is paraphyletic in relation to the family Draconematidae; the family Mermithidae is paraphyletic in relation to superfamily Mononchoidea.
- Two families (Oncholaimidae and Enchelidiidae) are combined in a highly supported clade, paraphyletic in relation to each other.
- Eight families are always resolved as polyphyletic. Of these, five families are consistently divided into two monophyletic and highly supported clades in exactly the same way as in previous (complete dataset) analyses (see Results, sections 1.1 and 1.2). The family Leptolaimidae is also consistently split in two clades, but only one of these clades is monophyletic with high bootstrap support. The family Chronogastridae is split in either two or three weakly supported clades. Two members of the family Diplopeltidae never form monophyletic clade.
Removing erroneous sequences increased bootstrap support in 12-16 clades and resolution (clades became monophyletic) in 6-7 clades (Table
Comparison of changes in bootstrap support (increase or decrease) and resolution for different nematode families between Neighbor joining analyses of complete and "filtered" datasets. Legend: "M" – clade changed from paraphyletic or polyphyletic to monophyletic; "P" – clade changed from monophyletic to paraphyletic or polyphyletic; "–" – clade remained paraphyletic or polyphyletic; "R" – monophyletic clade became fully resolved (bootstrap increased to ≥70%); "U" – monophyletic clade became unresolved (bootstrap decreased to <70%).
|
Taxon (family or *superfamily) |
Clustal-O |
Clustal-W |
MAFFT |
MUSCLE |
PRANK |
SILVA |
|
Rhabditidae |
0 |
0 |
+1 |
0 |
0 |
0 |
|
Plectidae |
-12 |
+1 |
-2 |
-5 |
+1 |
-3 |
|
Aphanolaimidae |
+8 |
-1 |
-6 |
-2 |
-2 |
0 |
|
Axonolaimidae |
– |
+57 M |
+47 M |
+42 M |
– |
– |
|
Comesomatidae |
+2 |
+1 |
+3 |
-7 |
+5 |
-1 |
|
Xyalidae |
+13 |
– |
+3 |
+56 R |
-18 |
+2 |
|
Siphonolaimidae |
+4 |
0 |
0 |
+1 |
0 |
0 |
|
Ceramonematidae |
-5 U |
-3 |
+5 |
+10 |
+2 |
+2 |
|
Desmoscolecidae |
+3 |
+3 |
+2 |
+8 |
-9 |
+1 |
|
Draconematidae |
-5 |
+3 |
+3 |
+4 R |
+8 |
-3 |
|
Monoposthiidae |
+100 MR |
+100 MR |
+100 MR |
+100 MR |
+100 MR |
+100 MR |
|
Selachinematidae |
+32 M |
+36 M |
+44 M |
+33 M |
+19 M |
+26 M |
|
Cyatholaimidae |
+93 MR |
+98 MR |
+90 MR |
+99 MR |
+96 MR |
+95 MR |
|
Chromadoridae |
+31 R |
+1 |
+3 |
-8 |
+2 |
+5 |
|
Mononchoidea* |
0 |
0 |
-1 |
0 |
0 |
0 |
|
Prismatolaimidae |
+1 |
+2 |
+1 |
+1 |
-2 |
+2 |
|
Tobrilidae |
+48 |
+64 |
-7 |
-16 |
+2 |
+41 R |
|
Enoplidae |
+100 MR |
+100 MR |
+100 MR |
+100 MR |
+100 MR |
+100 MR |
|
Thoracostomopsidae |
+93 MR |
+95 MR |
+97 MR |
+94 MR |
+97 MR |
+96 MR |
|
Phanodermatidae |
+28 M |
+4 |
– |
– |
– |
– |
|
Anticomidae |
+100 MR |
+100 MR |
+100 MR |
+100 MR |
+100 MR |
+100 MR |
|
Leptosomatidae |
0 |
0 |
0 |
+1 |
0 |
-1 |
|
Alaimidae |
+12 |
+4 |
0 |
+2 |
+3 |
0 |
Between six and seven families that were non-monophyletic (paraphyletic or polyphyletic) in the Neighbor joining analysis of complete dataset (section 1.1) were resolved as monophyletic after removing erroneous sequences. Bootstrap support for such families varied between 19% and 100%. As a result, 4-5 families crossed the upper threshold (≥70% bootstrap support) and were fully resolved. Thus, depending on the alignment, between five and seven new families were fully resolved (monophyletic with ≥70% bootstrap support) in the Neighbor joining analysis of the "filtered" dataset.
2.2. "Filtered" dataset, Maximum likelihood analysis
Similar to 1.2, the results were more variable between different alignments comparing to Neighbor joining analyses of the same set of data (Suppl. materials
- Out of 50 nematode families included in this dataset, 24 families are resolved as monophyletic and receive high bootstrap support (>70%) in all six analyses.
- Five families (Aphanolaimidae, Camacolaimidae, Xyalidae, Mononchoidea and Leptosomatidae) are also resolved as monophyletic, but their bootstrap support varies greatly between analyses, from the highest 74-89% to the lowest 37-69%.
- Eight families (Plectidae, Axonolaimidae, Ceramonematidae, Draconematidae, Selachinematidae, Tobrilidae, Enchelidiidae and Phanodermatidae) may either have very low to high bootstrap support, or can be resolved as paraphyletic or polyphyletic.
- Four familes are consistently resolved as paraphyletic: the family Monhysteridae includes families Xyalidae and Sphaerolaimidae as ingroup clades; the family Desmodoridae is paraphyletic in relation to the family Draconematidae; the family Oncholaimidae is paraphyletic in relation to the family Enchelidiidae; the family Oxystominidae is a paraphyletic "grade" that includes as one of its monophyletic clades a range of other taxa.
- Eight families are always resolved as polyphyletic. Of these, five families are consistently divided into two monophyletic and highly supported clades in exactly the same way as in previous analyses (see Results, sections 1.1, 1.2 and 2.1). The family Leptolaimidae is also consistently split in two clades, but only one of these clades is monophyletic with high bootstrap support. Separation of the family Chronogastridae into two clades is inconsistent among different analyses. Two members of the family Diplopeltidae never form monophyletic clade.
Removing erroneous sequences increased bootstrap support in 14-26 clades and resolution in 5-8 clades (Table
Comparison of changes in bootstrap support (increase or decrease) and resolution for different nematode families between Maximum likelihood analyses of complete and "filtered" datasets. Legend: "M" – clade changed from paraphyletic or polyphyletic to monophyletic; "P" – clade changed from monophyletic to paraphyletic or polyphyletic; "–" – clade remained paraphyletic or polyphyletic; "R" – monophyletic clade became fully resolved (bootstrap increased to ≥70%); "U" – monophyletic clade became unresolved (bootstrap decreased to <70%).
|
Taxon (family or *superfamily) |
Clustal-O |
Clustal-W |
MAFFT |
MUSCLE |
PRANK |
SILVA |
|
Anguinidae |
-1 |
+1 |
0 |
0 |
0 |
0 |
|
Rhabditidae |
0 |
+1 |
-9 |
-5 |
-5 |
0 |
|
Teratocephalidae |
-1 |
+1 |
+1 |
+1 |
0 |
+4 |
|
Plectidae |
-9 |
+3 |
-14 U |
-7 |
– |
+2 |
|
Aphanolaimidae |
+11 |
+4 |
-7 U |
+78 MR |
+3 |
+1 |
|
Camacolaimidae |
+22 R |
+71 MR |
-2 |
-6 |
+42 M |
-2 |
|
Axonolaimidae |
+47 M |
+64 M |
– |
+43 M |
+30 M |
+38 M |
|
Comesomatidae |
-14 |
+15 |
0 |
-1 |
+1 |
0 |
|
Xyalidae |
+3 |
+1 |
+1 |
-1 |
-6 |
-1 |
|
Siphonolaimidae |
+6 |
+1 |
0 |
0 |
+3 |
0 |
|
Ceramonematidae |
-2 |
+4 |
0 |
+18 R |
+10 |
– |
|
Desmoscolecidae |
0 |
+1 |
-1 |
+1 |
-3 |
+2 |
|
Draconematidae |
– |
– |
+36 M |
-5 |
+2 |
0 |
|
Monoposthiidae |
+100 MR |
+100 MR |
+100 MR |
+100 MR |
+100 MR |
+100 MR |
|
Selachinematidae |
+24 M |
+70 M R |
+67 M |
+47 M |
+49 M |
– |
|
Achromadoridae |
+4 |
-1 |
-7 |
+5 |
+6 |
0 |
|
Cyatholaimidae |
+88 MR |
+98 MR |
+94 MR |
+91 MR |
+96 MR |
+95 MR |
|
Chromadoridae |
+32 R |
+82 MR |
+95 MR |
+26 |
+6 |
+29 R |
|
Haliplectidae |
0 |
0 |
0 |
0 |
0 |
+1 |
|
Dorylaimoidea* |
0 |
0 |
0 |
0 |
0 |
-1 |
|
Mononchoidea* |
+22 |
-4 |
0 |
0 |
-9 |
-2 U |
|
Bathyodontidae |
+2 |
-5 |
+1 |
+1 |
-11 |
+1 |
|
Cryptonchidae |
0 |
+1 |
+1 |
-1 |
0 |
0 |
|
Mermithidae |
0 |
+4 |
+1 |
-1 |
+9 R |
+1 |
|
Prismatolaimidae |
-2 |
+2 |
-1 |
+1 |
-1 |
+1 |
|
Tripylidae |
0 |
0 |
-1 |
0 |
-1 |
0 |
|
Tobrilidae |
+31 |
0 |
-52 P |
– |
0 |
-1 |
|
Enchelidiidae |
-2 |
+2 |
+55 M |
-45 P |
-4 |
+3 |
|
Enoplidae |
+29 |
+35 R |
+40 R |
+32 R |
+28 |
+58 R |
|
Thoracostomopsidae |
+93 MR |
+97 MR |
+83 MR |
+90 MR |
+97 MR |
+91 MR |
|
Phanodermatidae |
– |
+5 |
– |
+39 M |
– |
– |
|
Anticomidae |
+100 MR |
+100 MR |
+100 MR |
+100 MR |
+100 MR |
+100 MR |
|
Leptosomatidae |
-2 |
3 |
-5 |
+11 |
+1 |
+1 |
|
Trefusiidae |
– |
– |
– |
– |
+10 M |
– |
|
Alaimidae |
+10 |
+2 |
-1 |
-2 |
-3 |
+1 |
|
Rhabdolaimidae |
+2 |
0 |
-1 |
-2 |
+3 |
+1 |
Between five and eight families that were non-monophyletic (paraphyletic or polyphyletic) in the Maximum likelihood analysis of complete dataset (section 1.2) were resolved as monophyletic after removing erroneous sequences. Bootstrap support for such families varied between 24% and 100%. As a result, 4-7 families crossed the upper threshold (≥70% bootstrap support) and were fully resolved. Thus, depending on the alignment, between five and eight new families were fully resolved (monophyletic with ≥70% bootstrap support) in the Maximum likelihood analysis of the "filtered" dataset.
2.3. "Filtered" dataset, summary
Exclusion of problematic sequences from the alignment (defined in section 1.3 above) resulted in substantial increase in resolution and support for many clades equivalent to family-level categories, because incorrect placement of each of them in previous analyses (complete dataset) affected resolution of two families, the one that they are identified with taxonomically, and the one that they are placed within in the phylogenetic analysis.
3.1. "Long" dataset, Neighbor joining analysis
Unlike in previous Neighbor joining analyses (sections 1.1 and 2.1), the results were more variable between different alignments (Suppl. materials
- Out of 48 nematode families included in this dataset, 30 families are resolved as monophyletic and receive high bootstrap support (>70%) in all six analyses. In the case of the family Trefusiidae, which was resolved as polyphyletic (consisting of two distinct clades) during the analysis of "complete" dataset, the entire clade of marine taxa (Trefusia and Rhabdocoma) was exluded, leaving the second clade of terrestrial taxa (Trischistoma and Tripylina) in the dataset.
- Eight families (Chronogastridae, Camacolaimidae, Axonolaimidae, Xyalidae, Ceramonematidae, Draconematidae, Selachinematidae and Tobrilidae) are also resolved as monophyletic, but their bootstrap support values vary greatly between analyses, from the highest 57-98% to the lowest 23-65%.
- The family Microlaimidae is resolved as monophyletic with very low bootstrap support (19%) in one case only, polyphyletic in all other instances.
- Four familes are consistently resolved as paraphyletic: the family Monhysteridae includes families Xyalidae and Sphaerolaimidae as ingroup clades; the family Desmodoridae is paraphyletic in relation to the family Draconematidae; the family Mermithidae is paraphyletic in relation to the superfamily Mononchoidea; the family Oncholaimidae is paraphyletic in relation to the family Enchelidiidae.
- Five families are always resolved as polyphyletic. Of these, only two families are consistently divided into two monophyletic and highly supported clades: the genus Terschellingia is always placed separately from the rest of Linchomoeidae; the genus Syringolaimus is always placed separately from the rest of Ironidae. The family Leptolaimidae is also consistently split in two clades, but only one of these clades is monophyletic with high bootstrap support. Two members of the family Diplopeltidae never form a monophyletic clade. Similarly, three members of the family Oxystominidae never form a monophyletic clade.
Removing erroneous sequences improved bootstrap support in 15-16 clades and resolution in 5-7 clades (Table
Comparison of changes in bootstrap support (increase or decrease) and resolution for different nematode families between Neighbor joining analyses of "filtered" and "long" datasets. Legend: "M" – clade changed from paraphyletic or polyphyletic to monophyletic; "P" – clade changed from monophyletic to paraphyletic or polyphyletic; "–" – clade remained paraphyletic or polyphyletic; "R" – monophyletic clade became fully resolved (bootstrap increased to ≥70%); "U" – monophyletic clade became unresolved (bootstrap decreased to <70%).
|
Taxon (family or *superfamily) |
Clustal-O |
Clustal-W |
MAFFT |
MUSCLE |
PRANK |
SILVA |
|
Anguinidae |
0 |
0 |
0 |
0 |
0 |
+1 |
|
Plectidae |
+1 |
+1 |
-9 |
0 |
-3 |
0 |
|
Chronogastridae |
+38 M |
+23 M |
+26 M |
+34 M |
+41 M |
+57 M |
|
Aphanolaimidae |
+9 R |
+2 |
+6 |
+15 |
+10 |
+5 |
|
Camacolaimidae |
+82 MR |
+80 MR |
+65 MR |
+67 MR |
+77 MR |
+69 MR |
|
Axonolaimidae |
+76 MR |
+28 R |
+32 R |
+11 |
+78 MR |
+77 MR |
|
Comesomatidae |
-5 |
+1 |
-2 |
+11 |
+2 |
+1 |
|
Xyalidae |
+4 |
+44 M |
+6 R |
-12 |
+48 R |
+29 |
|
Siphonolaimidae |
+2 |
0 |
0 |
-4 |
0 |
0 |
|
Ceramonematidae |
-15 |
+5 |
+4 |
+22 R |
+16 |
0 |
|
Desmoscolecidae |
+6 |
-14 |
-1 |
-16 |
+1 |
-2 |
|
Draconematidae |
+20 |
+25 R |
+56 R |
+1 |
+23 R |
+20 |
|
Microlaimidae |
– |
– |
– |
+19 M |
– |
– |
|
Selachinematidae |
+27 |
+29 |
+20 |
-7 |
+33 |
+1 |
|
Cyatholaimidae |
-3 |
0 |
+5 |
-2 |
-6 |
-5 |
|
Chromadoridae |
+8 |
+8 |
-1 |
-7 |
+8 |
+8 |
|
Mononchoidea* |
+1 |
-1 |
+1 |
+1 |
0 |
+1 |
|
Prismatolaimidae |
-6 |
-2 |
-4 |
-1 |
0 |
-1 |
|
Tobrilidae |
-7 |
-10 |
+21 |
+22 |
+4 |
+9 |
|
Enchelidiidae |
+99 MR |
+98 MR |
+97 MR |
+98 MR |
+99 MR |
+96 MR |
|
Thoracostomopsidae |
+7 |
+5 |
+3 |
+6 |
+3 |
+4 |
|
Leptosomatidae |
0 |
0 |
-1 |
0 |
0 |
0 |
|
Trefusiidae |
+93 MR |
+99 MR |
+87 MR |
+91 MR |
+79 MR |
+94 MR |
|
Anoplostomatidae |
+79 MR |
+99 MR |
+98 MR |
+97 MR |
+99 MR |
+98 MR |
|
Alaimidae |
0 |
-3 |
-5 |
+1 |
-2 |
-1 |
Between five and six families that were non-monophyletic (paraphyletic or polyphyletic) in the Neighbor joining analysis of "filtered" dataset (section 2.1) were resolved as monophyletic after removing erroneous sequences. Bootstrap support for such families varied between 19% and 99%. As a result, 4-5 families crossed the upper threshold (≥70% bootstrap support) and were fully resolved. Thus, depending on the alignment, between five and seven new families were fully resolved (monophyletic with ≥70% bootstrap support) in the Neighbor joining analysis of the "long" dataset.
3.2. "Long" dataset, Maximum likelihood analysis
In this case PRANK-based analysis again resolves the highest number of families (36 out of 50), and Clustal-O-based analysis resolves only 29 (Table
- Out of 48 nematode families included in this dataset, 23 families are resolved as monophyletic and receive high bootstrap support (>70%) in all six analyses.
- Eight families (Camacolaimidae, Xyalidae, Ceramonematidae, Mononchidae, Mermithidae, Tobrilidae, Leptosomatidae and Alaimidae) are also resolved as monophyletic, but their bootstrap support varies greatly between analyses, from the highest 69-95% to the lowest 43-69%.
- Nine families (Plectidae, Chronogastridae, Aphanolaimidae, Axonolaimidae, Draconematidae, Microlaimidae, Selachinematidae, Trefusiidae and Anoplostomatidae) may either have variable (low-to-high) bootstrap support, or can be resolved as paraphyletic or polyphyletic.
- Three familes are consistently resolved as paraphyletic: the family Monhysteridae includes families Xyalidae and Sphaerolaimidae as ingroup clades; the family Desmodoridae is paraphyletic in relation to the family Draconematidae; the family Oncholaimidae is paraphyletic in relation to the family Enchelidiidae.
- Five families are always resolved as polyphyletic in exactly the same way as in previous (Neighbor joining) analysis of "long" dataset (see Results, section 3.1).
Removing short sequences improved bootstrap support in 13-15 clades and resolution in 2-6 clades (Table
Comparison of changes in bootstrap support (increase or decrease) and resolution for different nematode families between Maximum likelihood analyses of "filtered" and "long" datasets. Legend: "M" – clade changed from paraphyletic or polyphyletic to monophyletic; "P" – clade changed from monophyletic to paraphyletic or polyphyletic; "–" – clade remained paraphyletic or polyphyletic; "R" – monophyletic clade became fully resolved (bootstrap increased to ≥70%); "U" – monophyletic clade became unresolved (bootstrap decreased to <70%).
|
Taxon (family or *superfamily) |
Clustal-O |
Clustal-W |
MAFFT |
MUSCLE |
PRANK |
SILVA |
|
Anguinidae |
+2 |
0 |
+1 |
0 |
0 |
0 |
|
Rhabditidae |
0 |
0 |
+20 |
-2 |
+6 |
0 |
|
Teratocephalidae |
0 |
0 |
-4 |
-2 |
+2 |
+1 |
|
Plectidae |
+13 |
+2 |
-56 P |
-45 P |
+45 M |
+2 |
|
Chronogastridae |
– |
– |
– |
– |
+49 M |
+41 M |
|
Aphanolaimidae |
+1 |
-80 P |
+13 R |
+2 |
-1 |
-3 |
|
Camacolaimidae |
+4 |
+6 |
+29 |
+41 R |
+31 R |
+12 |
|
Axonolaimidae |
-47 P |
+10 R |
+85 MR |
+23 |
+43 R |
+33 R |
|
Comesomatidae |
+10 |
-3 |
-2 |
-4 |
-3 |
-1 |
|
Xyalidae |
0 |
+3 |
-1 |
+9 |
+16 |
+9 |
|
Siphonolaimidae |
+4 |
-1 |
-2 |
-1 |
0 |
0 |
|
Ceramonematidae |
-19 |
-1 |
-13 |
+15 |
+17 |
+50 M |
|
Desmoscolecidae |
0 |
-3 |
+1 |
-1 |
-2 |
0 |
|
Draconematidae |
– |
+65 M |
+37 R |
+21 |
+35 R |
+8 |
|
Microlaimidae |
– |
+14 |
+9 |
+14 |
– |
– |
|
Selachinematidae |
+45 |
-1 U |
-4 |
-47 P |
+22 R |
+100 MR |
|
Ethmolaimidae |
0 |
0 |
0 |
-1 |
0 |
0 |
|
Achromadoridae |
+1 |
+2 |
+4 |
-5 |
0 |
-2 |
|
Cyatholaimidae |
-5 |
-20 |
-14 |
-8 |
-21 |
-18 |
|
Chromadoridae |
+1 |
+16 |
+3 |
0 |
+4 |
+3 |
|
Dorylaimoidea* |
-8 |
-5 |
-4 |
-2 |
-1 |
-3 |
|
Mononchoidea* |
-3 |
+2 |
+3 |
+15 |
+9 |
+4 R |
|
Bathyodontidae |
+2 |
+1 |
+7 |
-2 |
+10 |
0 |
|
Cryptonchidae |
0 |
0 |
-1 |
0 |
0 |
0 |
|
Mermithidae |
-2 |
0 |
+4 |
-7 |
-3 |
-5 |
|
Prismatolaimidae |
0 |
-2 |
+1 |
-4 |
-2 |
-2 |
|
Tripylidae |
0 |
0 |
+2 |
0 |
+1 |
0 |
|
Tobrilidae |
-9 |
+1 |
+60 M |
+53 M |
-6 |
+7 R |
|
Enchelidiidae |
+34 R |
+37 R |
+44 R |
+99 MR |
+43 R |
+35 R |
|
Thoracostomopsidae |
+7 |
+3 |
+17 |
+10 |
+3 |
+9 |
|
Leptosomatidae |
+34 R |
-9 |
+16 R |
+12 |
-5 |
0 |
|
Trefusiidae |
+52 M |
+80 MR |
– |
– |
+30 |
– |
|
Anoplostomatidae |
– |
+95 MR |
+89 MR |
+87 MR |
+93 MR |
+82 MR |
|
Alaimidae |
-8 |
-10 |
-22 U |
-9 |
-7 |
-20 U |
|
Rhabdolaimidae |
0 |
-7 |
0 |
-1 |
0 |
0 |
Between one and four families that were non-monophyletic (paraphyletic or polyphyletic) in the Maximum likelihood analysis of "filtered" dataset (section 2.2) were resolved as monophyletic after removing short sequences. Bootstrap support for such families varied between 41% and 100%. As a result, 0-2 families crossed the upper threshold (≥70% bootstrap support) and were fully resolved. Thus, depending on the alignment, between two and six new families were fully resolved (monophyletic with ≥70% bootstrap support) in the Maximum likelihood analysis of the "long" dataset.
3.3. "Long" dataset, summary
Exclusion of incomplete sequences from the alignment resulted in increase in resolution and support for several clades equivalent to family-level categories, although in case of Maximum likelihood analysis, a number of clades were resolved as paraphyletic or polyphyletic, or lost bootstrap support below the 70% threshold.
4. "Worst case" scenario
Preselected 25 sequences were added to original, complete dataset and re-analyzed using Clustal-O for alignment (phylogenies using Clustal-O-based alignment scored one of the worst in all analyses) and Maximum Likelihood for phylogeny inference. As expected, addition of new high quality sequences did not affect the resolution of the cladogram, but affected bootstrap support for monophyletic clades (Fig.
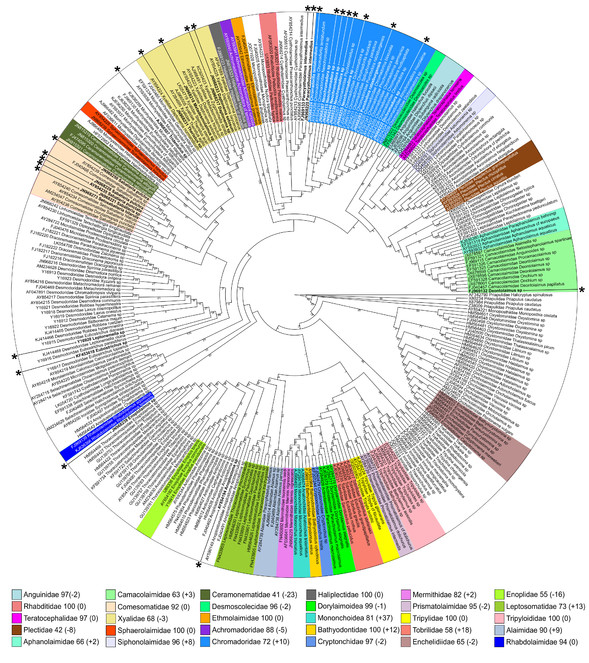
"Worst case" scenario – Maximum likelihood tree inferred using Clustal-O-based alignment of the complete dataset and 25 additional sequences (marked by asterisks). Numbers after family names in the legend indicate current bootstrap support for each clade and difference (in parenthesis) comparing to the original analysis (Clustal-O-based alignment, Maximum likelihood phylogeny inference, complete dataset) from the section 1.2 of the Results.
Out of 25 added sequences, only 18 could be assigned to family-level categories based on their clustering withing monophyletic clades Table
GenBank accession numbers and classification of sequences used in the final comparison of "worst case" and "best case" scenarios, and their identification outcomes. * denotes taxa placed in monophyletic clade but with low bootstrap support.
|
Acc. number |
Family |
Genus |
Species |
"worst-case" scenario |
"best case" scenario |
|
FJ969132 |
Camacolaimidae |
Deontolaimus |
sp. |
identified* |
identified |
|
AY854235 |
Comesomatidae |
Sabatieria |
punctata |
identified |
identified |
|
JN968250 |
Comesomatidae |
Sabatieria |
pulchra |
identified |
identified |
|
JN968228 |
Comesomatidae |
Sabatieria |
pulchra |
identified |
identified |
|
JN968221 |
Comesomatidae |
Sabatieria |
sp. |
identified |
identified |
|
JN968273 |
Comesomatidae |
Setosabatieria |
hilarula |
identified |
identified |
|
JN968231 |
Xyalidae |
Theristus |
sp. |
identified |
identified |
|
JN968217 |
Xyalidae |
Daptonema |
sp. |
identified |
identified |
|
JN968233 |
Xyalidae |
Daptonema |
setosum |
identified |
identified |
|
JN968218 |
Xyalidae |
Metadesmolaimus |
sp. |
identified |
identified |
|
AJ966507 |
Monhysteridae |
Tridentulus |
sp. |
unidentified |
unidentified |
|
Y16920 |
Desmodoridae |
Leptonemella |
sp. |
unidentified |
unidentified |
|
KF453618 |
Desmodoridae |
Eubostrichus |
sp. |
unidentified |
unidentified |
|
JN968220 |
Cyatholaimidae |
Paracyatholaimus |
intermedius |
unidentified |
identified |
|
FJ969133 |
Cyatholaimidae |
Paracyatholaimus |
intermedius |
unidentified |
identified |
|
JN968215 |
Chromadoridae |
Neochromadora |
sp. |
identified* |
identified |
|
JN968255 |
Chromadoridae |
Neochromadora |
sp. |
identified* |
identified |
|
JN968230 |
Chromadoridae |
Neochromadora |
sp. |
identified* |
identified |
|
JN968246 |
Chromadoridae |
Neochromadora |
sp. |
identified* |
identified |
|
JN968267 |
Chromadoridae |
Neochromadora |
sp. |
identified* |
identified |
|
JN968222 |
Chromadoridae |
Dichromadora |
sp. |
identified* |
identified |
|
JN968224 |
Chromadoridae |
Chromadorita |
tentabundum |
identified* |
identified |
|
JN968283 |
Chromadoridae |
Punctodora |
ratzeburgensis |
identified* |
identified |
|
AY854194 |
Anoplostomatidae |
Anoplostoma |
sp. |
unidentified |
identified |
|
JN968238 |
Thoracostomopsidae |
Enoplolaimus |
sp. |
unidentified |
identified |
5. "Best case" scenario
Similar to "worst case" scenario described in the previous section, same preselected 25 sequences were added to "long" dataset and re-analyzed using PRANK for alignment and Maximum Likelihood for phylogeny inference. Just like in the previous example, addition of new high quality sequences did not affect the resolution of the cladogram, but affected bootstrap support for monophyletic clades (Fig.
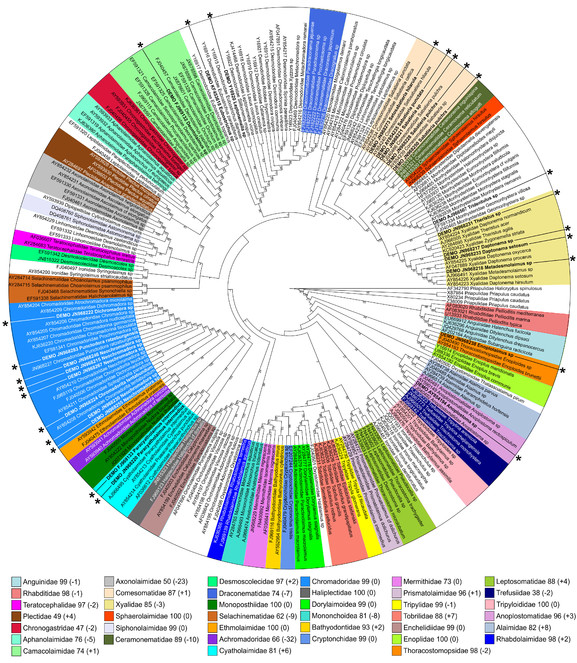
"Best case" scenario – Maximum likelihood tree inferred using PRANK-based alignment of the "long" dataset and 25 additional sequences (marked by asterisks). Numbers after family names in the legend indicate current bootstrap support for each clade and difference (in parenthesis) comparing to the original analysis (PRANK-based alignment, Maximum likelihood phylogeny inference, "long" dataset) from the section 3.2 of the Results.
Out of 25 added sequences, 22 could be assigned to family-level categories based on their clustering withing monophyletic clades Table
Discussion
Results of a phylogenetic analysis are strongly determined not only by the alignment and phylogeny inference algorithms, but also by the quality of the input data. However, influence of poor quality sequences on different parts of the phylogenetic tree is not equal. Resolution and bootstrap support for some nematode families remained consistent throughout all analyses and was not affected by the presence of erroneous or short sequences. Large number of such families are unfortunately represented in current analysis by only few taxa (2-4 species), either due to limited availability of high quality sequences in the reference databases (Teratocephalidae, Siphonolaimidae, Sphaerolaimidae, Desmoscolecidae, Ethmolaimidae, Achromadoridae, Haliplectidae, Rhabdolaimidae, Bathyodontidae, Cryptonchidae), or because such families are mainly freshwater/terrestrial (Anguinidae, Rhabditidae, Mononchoidea, Dorylaimoidea, Prismatolaimidae, Tripylidae, Alaimidae). The latter are used here mainly to increase taxon coverage and sequence variability. The former are always represented by co-specific or co-generic taxa which monophyly is not questioned here. Both categories will not be further considered in the discussion.
The other families (marine and well represented with multiple sequences) that were always resolved as monophyletic in all analyses, independently from the alignment and phylogeny inference algorithms, are only Comesomatidae and Tripyloididae. There are three families that are resolved as polyphyletic in all analyses: Diplopeltidae, Linhomoeidae and Ironidae. These are similarly resolved in the analyses using nearly full-length 18S rRNA (
Higher taxa (clades equivalent to orders and classes in the nematode classification) were not fully resolved in any of performed analyses, with few exceptions. Order Monhysterida was fully resolved (monophyletic with high support) in all analyses using Maximum likelihood inference, and in some analyses using Neighbor joining inference (MAFFT-based alignment of the "filtered" dataset, Clustal-O, Clustal-W, MAFFT and PRANK-based alignments of the "long" dataset). Three terrestrial orders Dorylaimida, Rhabditida and Tylenchida, all of which were represented by very few sequences, were fully resolved in all analyses. Other orders were either poly- or paraphyletic, while bootstrap support for many basal dichotomies was lower than the required threshold.
Alignments
Various multiple-sequence alignment software naturally produced alignments of varying quality, which affected the final outcome of all analyses in this comparison. Visual examination of alignment files showed that all of them, including alignments downloaded from SILVA database, were not able to cope with hypervariable regions of rRNA molecule, evidenced by the fact that identical (very similar) segments of sequences of closely related taxa (same genera) can be aligned differently. In this test, SILVA-based alignments produced some of the worst results, alongside Clustal-O and MAFFT. On the other hand, PRANK, Clustal-W and MUSCLE-based alignments produced cladograms with higher resolution and support, but the improvements are not always significant, and may not be observed for other barcoding regions or other groups of organisms.
Phylogeny inference algorithms
Neighbor joining algorithm was shown to be effective in matching anonymous sequences to sequences that were preliminary identified (
Problematic sequences
Improvement in the resolution and support achieved in the "filtered" dataset should be attributed to the exclusion of problematic (erroneous) sequences, namely: Anticoma sp. (AY692344), Parodontophora sp. (AM234630), Oncholaimus sp. (KF591739), Gammanema sp. (KF591723), Cyatholaimus sp. (JN968214), Longicyatholaimus sp. (LK054720), Pomponema sp. (KF591743) and Monoposthia costata (AY854221). Removing these sequences affected the resolution and support of both clades (families) that they are identified with taxonomically, and clades (families) that they were placed within during phylogeny inference. Moreover, if anonymous OTU is placed in the clade (monophyletic and highly supported) that includes problematic sequences, it might not be always possible to evaluate with confidence if it genuinely related to taxa representing majority of the clade, or if its placement is caused by similarity to a problematic sequence.
Short sequences
Removing of short sequences increased support and resolution much less significantly, and at a cost of loss of reference data. In case of two families (Anoplostomatidae and Trefusiidae) one of the clades that defined these taxa as polyphyletic in the analyses of complete and "filtered" datasets, was completely absent in the "long" dataset, thus artificially defining Anoplostomatidae and Trefusiidae as monophyletic. In this case, it is important to find a balance between the number of incomplete sequences and completeness of the reference dataset.
"Worst case" versus "Best case" scenarios
This comparison shows the differences in how the same set of "blind" taxa are assigned using two different, "worst case" Fig.
Paraphyletic clades
Several important and diverse families of marine nematodes are always resolved as paraphyletic in present analysis. Examples include family Monhysteridae (including Xyalidae and Sphaerolaimidae as ingroup clades), Desmodoridae (including Draconematidae as ingroup clade) and Oncholaimidae (including Enchelidiidae as ingroup clade). At least one of them (Desmodoridae) is similarly resolved in large scale phylogenetic studies that use nearly full-length 18S and partial 28S rRNA sequences (
Polyphyletic clades
Often polyphyletic clades are caused by insufficient phylogenetic signal of the relatively short (barcode-size) marker. Several examples discussed in sections 1.1 and 1.2 of the Results confirm that erroneous sequences are another important culprit, affecting both resolution and support of clades. In both cases, affected clades are unlikely to be useful for the identification of anonymous barcodes that are placed within them. Polyphyly of families can also reflect genuine divergent history of the phylogenetic marker (barcoding region) that is not followed in current classification or not supported by alternative phylogenies (based on full-length gene or multiple genes). In such cases, anonymous barcodes could still be assigned to one of the subclades and classified within the family, as long as their placement in such subclades is well supported, subclades are well represented with reference taxa and have sufficient bootstrap support.
Conclusions
- A number of reference sequences were found in this analysis to be "misplaced" in the phylogenetic trees, suggesting that they are likely incorrectly identified or have sequencing errors. Public sequence databases do include erroneous sequences that will affect the results. Therefore, it is necessary to raise awareness about the importance of quality control of reference datasets for erroneous and incomplete sequences, as both will have negative impact on the results of taxonomy-assignment procedures.
- The choice of alignment and phylogeny inference algorithms will affect the results. Moreover, alignment may have bigger impact on the topology of the final tree than either one of the phylogeny inference algorithms used in this study (Neighbor joining versus Maximum likelihood). It is thus recommended to use more then one combination of both alignment and phylogeny inference algorithms in order to be able to reliably identify anonymous sequences.
- It is important to understand that trees built using short barcode-size sequences of 18S rRNA will never correspond to the trees based on the full length of the gene and complex alignment and phylogeny inference models. Therefore, some taxa (families, orders) that are monophyletic in the "full-length 18S rRNA" tree may not be monophyletic in the barcode-based tree. Nonetheless, it is still possible to assign taxonomic placement to anonymous OTUs that fall within paraphyletic and polyphyletic clades in the barcode-based tree, depending on their topology and bootstrap support.
- There were a number of families in our analysis that were represented only by two closely related species and were usually resolved as monophyletic. In such cases, it is difficult to forsee if they will cluster with unidentified OTUs in real-life analyses. Sequencing of more reference taxa from such families should be of higher priority than sequencing of taxa from families that are well represented in reference databases.
Grant title
Project entitled "Systematics of Swedish free-living nematodes of the orders Desmodorida and Araeolaimida" financed by the Swedish Taxonomy Initiative, Artdatabanken, Sweden.
References
- DNA barcode analysis: a comparison of phylogenetic and statistical classification methods.BMC Bioinformatics10:S10. https://doi.org/10.1186/1471-2105-10-s14-s10
- Performance, accuracy, and web server for evolutionary placement of short sequence reads under maximum likelihood.Systematic Biology60(3):291‑302. https://doi.org/10.1093/sysbio/syr010
- Barcoding marine nematodes: an improved set of nematode 18S rRNA primers to overcome eukaryotic co-interference.Hydrobiologia641(1):245‑251. https://doi.org/10.1007/s10750-009-0088-z
- Development and evaluation of a DNA-barcoding approach for the rapid identification of nematodes.Marine Ecology Progress Series320:1‑9. https://doi.org/10.3354/meps320001
- Metabarcoding as a tool for investigating arthropod diversity in Nepenthes pitcher plants.Austral Ecologyn/a:n/a‑n/a. https://doi.org/10.1111/aec.12271
- Metabarcoding is powerful yet still blind: a comparative analysis of morphological and molecular surveys of seagrass communities.PLOS ONE10(2):e0117562. https://doi.org/10.1371/journal.pone.0117562
- An integrated approach to fast and informative morphological vouchering of nematodes for applications in molecular barcoding.Philosophical Transactions of the Royal Society B: Biological Sciences360(1462):1945‑1958. https://doi.org/10.1098/rstb.2005.1726
- Exploring the use of cytochrome oxidase c subunit 1 (COI) for DNA barcoding of free-living marine nematodes.PLoS ONE5(10):e13716. https://doi.org/10.1371/journal.pone.0013716
- MUSCLE: multiple sequence alignment with high accuracy and high throughput.Nucleic Acids Research32(5):1792‑1797. https://doi.org/10.1093/nar/gkh340
- Search and clustering orders of magnitude faster than BLAST.Bioinformatics26(19):2460‑2461. https://doi.org/10.1093/bioinformatics/btq461
- Molecular barcodes for soil nematode identification.Molecular Ecology11(4):839‑850. https://doi.org/10.1046/j.1365-294x.2002.01485.x
- Second-generation environmental sequencing unmasks marine metazoan biodiversity.Nature Communications1(7):98. https://doi.org/10.1038/ncomms1095
- Comparison of the accuracies of several phylogenetic methods using protein and DNA sequences.Molecular Biology and Evolution22(3):792‑802. https://doi.org/10.1093/molbev/msi066
- Sensitivity of ribosomal RNA character sampling in the phylogeny of Rhabditida.Journal of Nematology47(4):337‑355.
- Methods for comparative metagenomics.BMC Bioinformatics10:S12. https://doi.org/10.1186/1471-2105-10-s1-s12
- Reverse taxonomy for elucidating diversity of insect-associated nematodes: a case study with termites.PLoS ONE7(8):e43865. https://doi.org/10.1371/journal.pone.0043865
- MAFFT Multiple Sequence Alignment Software version 7: improvements in performance and usability.Molecular Biology and Evolution30(4):772‑780. https://doi.org/10.1093/molbev/mst010
- CREST – classification resources for environmental sequence tags.PLoS ONE7(11):e49334. https://doi.org/10.1371/journal.pone.0049334
- Clustal W and Clustal X version 2.0.Bioinformatics (Oxford, England)23(21):2947‑8. https://doi.org/10.1093/bioinformatics/btm404
- Phylogenetic relationships within the superfamily Desmodoroidea (Nematoda: Desmodorida), with descriptions of two new and one known species.Zoological Journal of the Linnean Society176(3):511‑536. https://doi.org/10.1111/zoj.12324
- Metabarcoding dietary analysis of coral dwelling predatory fish demonstrates the minor contribution of coral mutualists to their highly partitioned, generalist diet.PeerJ3:e1047. https://doi.org/10.7717/peerj.1047
- Interactive tree of life (iTOL) v3: an online tool for the display and annotation of phylogenetic and other trees.Nucleic Acids ResearchN/A:gkw290. https://doi.org/10.1093/nar/gkw290
- The EMBL-EBI bioinformatics web and programmatic tools framework.Nucleic Acids Research43:W580‑W584. https://doi.org/10.1093/nar/gkv279
- webPRANK: a phylogeny-aware multiple sequence aligner with interactive alignment browser.BMC Bioinformatics11(1):579. https://doi.org/10.1186/1471-2105-11-579
- Mesquite: a modular system for evolutionary analysis.3.04. URL: http://mesquiteproject.org
- pplacer: linear time maximum-likelihood and Bayesian phylogenetic placement of sequences onto a fixed reference tree.BMC Bioinformatics11(1):538. https://doi.org/10.1186/1471-2105-11-538
- Proceedings of the Gateway Computing Environments Workshop.New Orleans, LA.
- Profiling nematode communities in unmanaged flowerbed and agricultural field soils in Japan by DNA barcode sequencing.PLoS ONE7(12):e51785. https://doi.org/10.1371/journal.pone.0051785
- Statistical assignment of DNA sequences using Bayesian phylogenetics.Systematic Biology57(5):750‑757. https://doi.org/10.1080/10635150802422316
- Compilation of small ribosomal subunit RNA sequences.Nucleic Acids Research18 Suppl:2237‑2317.
- The SILVA ribosomal RNA gene database project: improved data processing and web-based tools.Nucleic Acids Research41:D590‑D596. https://doi.org/10.1093/nar/gks1219
- High-throughput sequencing of nematode communities from total soil DNA extractions.BMC Ecology15(1):3. https://doi.org/10.1186/s12898-014-0034-4
- iDNA from terrestrial haematophagous leeches as a wildlife surveying and monitoring tool – prospects, pitfalls and avenues to be developed.Frontiers in Zoology12(1):24. https://doi.org/10.1186/s12983-015-0115-z
- Fast, scalable generation of high-quality protein multiple sequence alignments using Clustal Omega.Molecular Systems Biology7(1):539‑539. https://doi.org/10.1038/msb.2011.75
- Worldwide Analysis of Sedimentary DNA Reveals Major Gaps in Taxonomic Knowledge of Deep-Sea Benthos.Frontiers in Marine Science3:1. https://doi.org/10.3389/fmars.2016.00092
- RAxML version 8: a tool for phylogenetic analysis and post-analysis of large phylogenies.Bioinformatics30(9):1312‑1313. https://doi.org/10.1093/bioinformatics/btu033
- MLTreeMap - accurate Maximum Likelihood placement of environmental DNA sequences into taxonomic and functional reference phylogenies.BMC Genomics11(1):461. https://doi.org/10.1186/1471-2164-11-461
- MEGA6: Molecular Evolutionary Genetics Analysis Version 6.0.Molecular Biology and Evolution30(12):2725‑2729. https://doi.org/10.1093/molbev/mst197
- Thalassomermis megamphis n. gen., n. sp. (Mermithidae: Nemata) from the Bathyal South Atlantic Ocean.Journal of nematology29(4):451‑464.
- A phylogenetic tree of nematodes based on about 1200 full-length small subunit ribosomal DNA sequences.Nematology11(6):927‑950. https://doi.org/10.1163/156854109x456862
- Naive Bayesian classifier for rapid assignment of rRNA Sequences into the new bacterial taxonomy.Applied and Environmental Microbiology73(16):5261‑5267. https://doi.org/10.1128/aem.00062-07
- The European database on small subunit ribosomal RNA.Nucleic Acids Research30(1):183‑185.