|
Biodiversity Data Journal :
Data Paper (Biosciences)
|
|
Corresponding author:
Academic editor: Pavel Stoev
Received: 27 Sep 2016 | Accepted: 21 Oct 2016 | Published: 28 Oct 2016
© 2016 Oliver Pescott
This is an open access article distributed under the terms of the Creative Commons Attribution License (CC BY 4.0), which permits unrestricted use, distribution, and reproduction in any medium, provided the original author and source are credited.
Citation:
Pescott O (2016) A systematic florula of a disturbed urban habitat: Pavements of Sheffield, England. Biodiversity Data Journal 4: e10658. https://doi.org/10.3897/BDJ.4.e10658
|
|
Abstract
Background
Human settlements are of increasing interest to ecologists, a fact demonstrated by the recent cluster of book-length treatments of the topic (
New information
Few systematic, randomised surveys at fine spatial grain exist for urban habitats, and even fewer of these surveys are in the public domain. This study was designed as a systematic florula (i.e. a small flora) of a relatively discrete urban habitat in order to provide a baseline that would enable robust insights into future environmental change. In addition, the dataset is likely to be useful for comparative studies of plant traits, particularly those of highly disturbed habitats (
Keywords
urban, vascular plants, systematic survey, randomised survey, Sheffield, England, urban ecology, pavement, sidewalk, urban flora, monitoring, baseline study, disturbance
Introduction
A considerable amount of information on urban floras already exists, as shown in Britain and Ireland by the number of published Floras of towns and cities (e.g.
Although the author is aware of well-documented studies of particular urban habitats (see the bibliography of
General description
To record the vascular flora of a disturbed habitat, in an urban setting, within a systematic, randomised framework.
The resulting species records presented in this data paper have also been shared with the Sorby Natural History Society (www.sorby.org.uk), and the Botanical Society of Britain and Ireland (BSBI) (www.bsbi.org) as 1 km2 occupancy data. Through inclusion in the database of the BSBI, these species occurrence records will ultimately form part of a BSBI dataset on the UK National Biodiversity Network (www.nbn.org.uk), which itself is a node of GBIF (www.gbif.org). Note, however, that the species occurrence data available through this route will not be attached to survey metadata essential for their interpretation and use as an individual systematically recorded dataset (i.e. disaggregation would be difficult in the absence of prior knowledge of the protocol of the project), hence its presentation in full here.
Sampling methods
-1.54360021785, -1.33914691539, 53.3205532457, 53.4364503199 (Long. min, Long. max, Lat. min, Lat. max). See also (Suppl. material
All 1 km2 grid cells of the British National grid (OSGB 1936 EPSG:27700) with at least 25% 'built-up' land cover in the Centre for Ecology & Hydrology Land Cover Map 2000 (
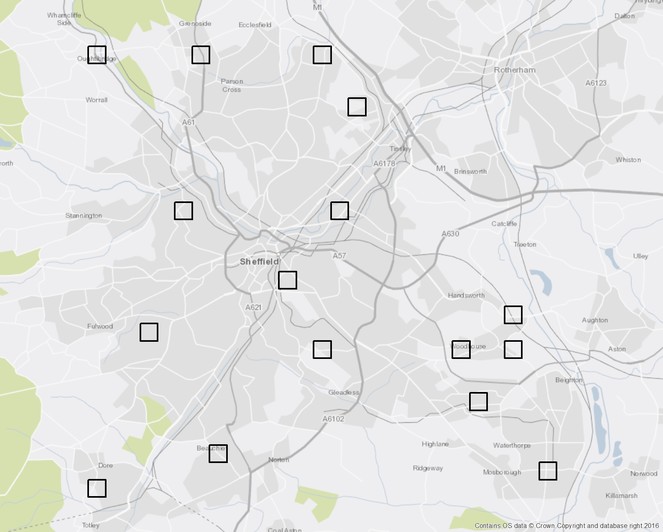
Within a selected 1 km2 urban cell, all four 500 x 500 m (0.25 km2) sub-cells with at least 50% built-up area were numbered, with a single sub-cell being selected for survey using the random number method described above. In the field, the 16 selected 500 x 500 m sub-cells (Fig.
All plants identified in this study were identified by the author. Plant specimens which could not be named in the field were keyed using the current standard Flora for Britain and Ireland (
Geographic coverage
The city of Sheffield, England.
53.3205532457 and 53.4364503199 Latitude; -1.54360021785 and -1.33914691539 Longitude.
Taxonomic coverage
This study includes all vascular plants found growing in target habitat; 183 taxa were recorded in total. See Sampling methods above for more information on habitat recording criteria.
Temporal coverage
This survey was intended as a cross-sectional 'snapshot' of the habitat of interest, therefore the surveys were constrained to the period of late June and early July in all three years of the survey. Although this means that a small number of late-flowering species (e.g. Conyza spp.) were only identified to genus level (where vegetative identification was assessed to be uncertain), the consistency in survey period should have reduced issues with species detectability due to phenology within this study (multiple repeat visits to sub-cells at different times of year were outside of the resources of this unfunded project). Future re-surveys of this habitat in Sheffield should take this temporal restriction into account, particularly if phenological shifts due to climatic changes have shifted the corresponding period of growth to different calendar dates.
Usage rights
Data resources
Vascular plant occupancy data. Taxonomy and nomenclature follow
| Column label | Column description |
|---|---|
| recordedName | Species or species aggregate as recorded in the field. |
| nameAuthor | Authority for name, where appropriate. |
| date | date (DD/MM/YYYY) |
| 1kmLocation | Lettered British National grid reference for sampled 1 km square. |
| 1kmQuadrant | Quadrant (i.e. 500 x 500 m sub-cell) of 1 km square sampled. |
| centroidEasting | Easting component of centroid of 500 x 500 m sampled sub-cell. |
| centroidNorthing | Northing component of centroid of 500 x 500 m sampled sub-cell. |
| buffer (m) | Distance (in metres) by which centroids should be buffered and squared off in order to recreate the sampled areas. See Suppl. material 1. for an ESRI Shapefile of these areas. |
| comment | Comments relating to species occurrence observations made in the field. |
Acknowledgements
I would like to acknowledge the support of the Sorby Natural History Society (www.sorby.org.uk). Their efforts to promote knowledge of biodiversity in the Sheffield region supported my interest in plant diversity during my time in the city. The writing of this data paper was supported by the Biological Records Centre, CEH Wallingford, which receives support from the Joint Nature Conservation Committee and the Natural Environment Research Council (via National Capability funding to the Centre for Ecology & Hydrology, project NEC04932).
Author contributions
OLP designed the study, conducted the surveys, collated the data, and wrote the paper.
References
- Urban flora of Belfast.Institute of Urban Studies,Belfast,206pp.
- Flora von Basel und Umgebung.1.Mitteil Naturforsch Ges Basel,Liestal,550pp. [InGerman].
- Flora von Basel und Umgebung.2.Mitteil Naturforsch Ges Basel,Liestal,500pp. [InGerman].
- Flora of the London area.London Natural History Society,London,225pp.
- Street floras in Cambridge and Aberystwyth.Nature in Cambridgeshire42:3‑26.
- The Changing Flora of Glasgow.Edinburgh University Press,Edinburgh,384pp.
- Plant traits and extinction in urban areas: a meta-analysis of 11 cities.Global Ecology and Biogeography20(0):509‑519. https://doi.org/10.1111/j.1466-8238.2010.00633.x
- London's Natural History.Collins,London,282pp.
- Urban Regions: Ecology and Planning Beyond the City.Cambridge University Press,Cambridge,478pp.
- Urban Ecology: Science of Cities.Cambridge University Press,Cambridge,476pp.
- The UK Land Cover Map 2000: Construction of a Parcel-Based Vector Map from Satellite Images.Cartographic Journal, The39:15‑25. https://doi.org/10.1179/000870402787288009
- The Flora of Derby.K. Futter and P. Raynes,Derby,62pp.
- Urban Ecology.Cambridge University Press,Cambridge,332pp.
- Nature in Towns and Cities.William Collins,London,464pp.
- Urban plant ecology patterns and processes: a case study of the flora of the City of Plymouth, Devon, U.K.Journal of Biogeography26(6):1281‑1298. https://doi.org/10.1046/j.1365-2699.1999.00350.x
- Flora der Stadt Zürich (1984–1998).Birkhäuser,Berlin,1432pp. [InGerman].
- Ecology of Cities and Towns: A Comparative Approach.Cambridge University Press,Cambridge,746pp.
- Urban Ecology: Patterns, Processes, and Applications.OUP,Oxford,392pp.
- Ecological monitoring with citizen science: the design and implementation of schemes for recording plants in Britain and Ireland.Biological Journal of the Linnean Society115(0):505‑521. https://doi.org/10.1111/bij.12581
- The Biological Records Centre: a pioneer of citizen science.Biological Journal of the Linnean Society115(0):475‑493. https://doi.org/10.1111/bij.12548
- The Vegetative Key to the British Flora.John Poland & BSBI,Southampton,526pp. [ISBN978-0-9560144-0-5]
- New Atlas of the British and Irish Flora.Oxford University Press,Oxford,910pp.
- Flore de la Ville de Fribourg.Editions Universitaires,Fribourg,608pp. [InFrench].
- A Flora of the Sheffield Area.Sorby Natural History Society,Sheffield,308pp.
- Studies in the floristic diversity of Durham walls, 1958–2008.Watsonia27:323‑338.
- Value for birds of the green corridors associated with Rivers Don and Rother and their tributaries in the Sheffield Area.Sorby Record46:2‑21.
- New Flora of the British Isles.Cambridge University Press,Cambridge,1232pp.
- Traits of British alien and native urban plants.Journal of Ecology96(5):853‑859. https://doi.org/10.1111/j.1365-2745.2008.01383.x
- Flora of Birmingham and the Black Country.Pisces Publications,Berkshire, UK,496pp.
- A Flora of Shrewsbury.The University of Birmingham & the Shropshire Botanical Society,Shrewsbury,28pp.
- A conceptual framework for predicting the effects of urban environments on floras.Journal of Ecology97(1):4‑9. https://doi.org/10.1111/j.1365-2745.2008.01460.x
- Constructed Climates: A Primer on Urban Environments.University of Chicago Press,Chicago,288pp.
Supplementary material
An ESRI Shapefile (EPSG: 27700) containing spatial polygons delimiting the sampled areas (500 x 500 m sub-cells; Fig. 1) of this study. Attribute table columns (title; contents) are: 1km_square (1 km2 cell reference according to the lettered format of the Britian National grid); Quadrant (compass-point quadrant, i.e. 500 x 500 m sub-cell sampled); Location (textual description of geographic location); Ref (reference to this data paper).