|
Biodiversity Data Journal :
Research Article
|
|
Corresponding author: Quentin Cronk (quentin.cronk@ubc.ca)
Academic editor: Lyubomir Penev
Received: 17 Oct 2016 | Accepted: 09 Jan 2017 | Published: 13 Jan 2017
© 2017 Rungtip Wonglersak, Quentin Cronk, Diana Percy
This is an open access article distributed under the terms of the Creative Commons Attribution License (CC BY 4.0), which permits unrestricted use, distribution, and reproduction in any medium, provided the original author and source are credited.
Citation:
Wonglersak R, Cronk Q, Percy D (2017) Salix transect of Europe: structured genetic variation and isolation-by-distance in the nettle psyllid, Trioza urticae (Psylloidea, Hemiptera), from Greece to Arctic Norway. Biodiversity Data Journal 5: e10824. https://doi.org/10.3897/BDJ.5.e10824
|
|
Abstract
Background
The common nettle (Urtica dioica L.) is co-associated with willows (Salix spp.) in riparian habitats across Europe. We sampled the widespread nettle psyllid, Trioza urticae (Linné, 1758), from Urtica in willow habitats on a megatransect of Europe from the Aegean to the Arctic Ocean. The aim of this study was to use an unusually widespread insect to assess the influence of geographic distances and natural geographic barriers on patterns of genetic variation and haplotype distribution.
New information
Phylogeographic analysis using DNA sequences of two mtDNA regions, COI and cytB, shows that T. urticae specimens are organized into four regional groups (southern, central, northern and arctic). These groups are supported by both phylogenetic analysis (four geographically-based clades) and network analysis (four major haplotype groups). The boundary between southern and central groups corresponds to the Carpathian Mountains and the boundary between the central and northern groups corresponds to the Gulf of Finland. Overall these groups form a latitudinal cline in genetic diversity, which decreases with increasing latitude.
Keywords
biogeography, haplotype network, latitudinal cline, isolation by distance, megatransect, Triozidae
Introduction
A transect of Europe that sampled Salix (willow) habitats from the Aegean to the Arctic ocean has already been described [
The aim of this study is to take advantage of a widely dispersed pan-European insect, together with a megatransect approach to sampling to assess population structuring across Europe, particularly in relation to latitude. We wish in particular to determine the effect of biogeographic barriers across Europe on genetic structuring of T. urticae populations.
Materials and Methods
Specimen selection
From the 42 sites sampled along the Salix transect of Europe [
Summary of sites sampled. Further information about sites can be found in
|
Site no. |
Country |
Longitude |
Latitude |
No. of specimens sequenced |
|
2 |
Greece |
22.3102 |
38.9020 |
5 |
|
5 |
Greece |
23.2739 |
41.1133 |
5 |
|
8 |
Bulgaria |
23.8106 |
42.9240 |
5 |
|
11 |
Romania |
23.1903 |
44.9620 |
5 |
|
14 |
Hungary |
21.3127 |
46.7007 |
5 |
|
17 |
Poland |
21.6975 |
49.4635 |
5 |
|
20 |
Poland |
21.1971 |
51.7750 |
5 |
|
22 |
Poland |
22.3030 |
53.5548 |
5 |
|
24 |
Lithuania |
23.7742 |
54.9258 |
5 |
|
26 |
Latvia |
24.2516 |
56.7114 |
5 |
|
29 |
Estonia |
24.9358 |
59.4029 |
5 |
|
30 |
Finland |
24.6584 |
60.2730 |
5 |
|
32 |
Finland |
26.1237 |
62.0496 |
5 |
|
34 |
Finland |
25.5266 |
64.0507 |
5 |
|
35 |
Finland |
25.5381 |
64.6129 |
1 |
|
37 |
Finland |
23.8945 |
66.2495 |
5 |
|
39 |
Finland |
23.6341 |
67.9118 |
5 |
|
42 |
Norway |
23.6658 |
70.6523 |
4 |
|
D-iGR |
Greece |
20.5231 |
39.2358 |
2 |
|
K-iiNL |
Netherlands |
6.0353 |
53.1508 |
5 |
|
L-FR |
France |
1.8551 |
50.8652 |
2 |
|
Eng |
England, UK |
0.2301 |
51.4386 |
2 |
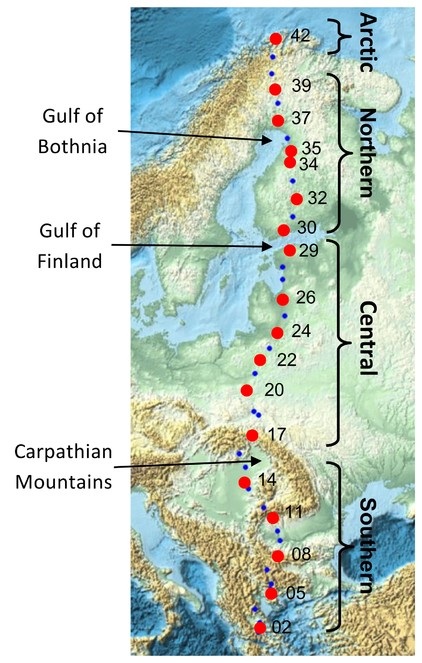
Map showing all 42 sites along an eastern European megatransect. Trioza urticae samples were selected from 18 sites (red points) along the transect. Three major natural geographic barriers are indicated, and the four regional partition of sites (southern, central, northern, arctic) referred to in the genetic analyses are shown.
Sequencing
DNAs from 96 specimens, including 87 samples from the eastern European megatransect and 9 samples from western Europe, were extracted using a Qiagen DNeasy Blood and Tissue Kit [QIAGEN Ltd., Manchester, UK]. Two regions of mtDNA; cytochrome c oxidase subunit I (COI) and cytochrome B (cytB) were amplified using standard PCR procedures as described previously [
Data analysis
To determine regional clade structure for the 82 transect samples, a NJ analysis (p-distance) with 1,000 bootstrap replicates was performed in PAUP*, and a maximum likelihood (ML) analysis was conducted with 100 rapid bootstrap replicates using RAxML (version 8.2.4) [
To analyse haplotype variation across the latitudinal gradient, the DNA sequences were used to create a haplotype median-joining network [
Latitudinal clines of genetic variation were assessed based on the concept of “isolation by distance” (IBD) [
Results
Genetic variation and phylogeography
The 857bp matrix of all 96 samples contains 37 parsimony informative characters, 36 of which are found among the transect samples, and the addition of the nine western European individuals adds only one additional informative character. Total sequence divergence (p-distances) for all 96 samples was 2.8%. Each of the phylogenetic analyses are able to separate populations into regional groups. The consensus analysis using MP with all 96 samples recovers three of the four regional groups (Fig.
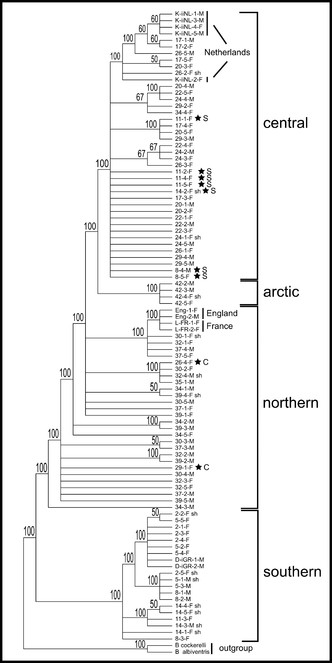
Majority-rule consensus tree of the MP analysis incorporating all 96 samples. The four regional clades as determined from the ML and haplotype analyses are indicated. Stars indicate the position of individuals within regional clades but not from that region (see also ML and haplotype network in Figs
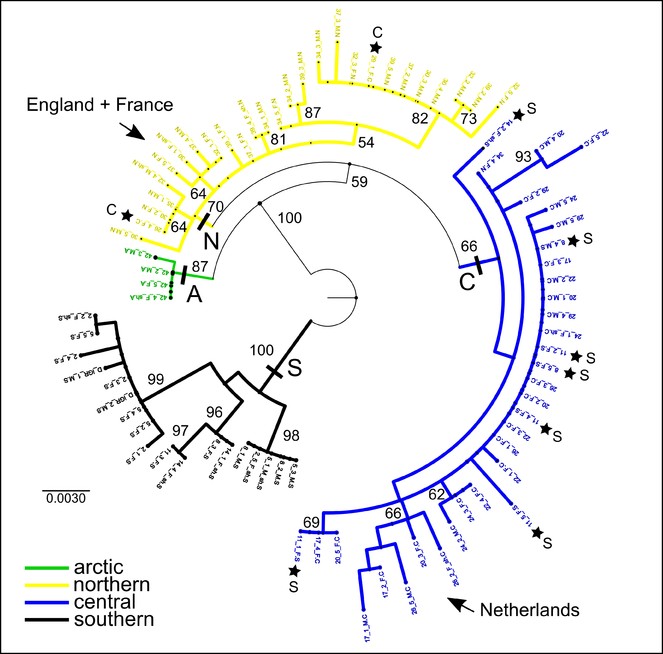
The ML tree of 82 samples along the transect showing bootstrap support values. Four regional clades are identified (southern, central, northern, arctic) and the clade position of the non-included western European samples is indicated. Stars indicate the position of individuals within regional clades but not from that region (see also MP and haplotype network in Figs
In total, 48 haplotypes were found using 82 samples along the transect. The sites with the most sequence divergence among individuals (>1.5%) are all southern sites: site 11 (1.9%), site 14 (1.8%), and site 8 (1.6%). This is due to some samples from these sites also clustering within the central region clade. Among the other regions the most diverse site is a central region site, 26 (1.1%), which has some individuals clustering in the northern region clade (Figs
Analyses of molecular variation between and within sites
The simple AMOVA found 70.4 percent variation between sites, and 29.6 percent variation within sites. The nested AMOVA found 61.3 percent variation between regional groups, 14.9 percent variation between sites within groups, and 23.81 percent within sites within groups. The φST, which is a measure of variance among populations relative to total variance, shows significant differentiation among the populations across the transect (φST = 0.76, p < 0.001, 1000 permutations). This confirms that there is substantial population structure in the data even though the overall mtDNA sequence divergence is less than 3 percent. Furthermore, φCT, which is a measure of variance among regional groups relative to total variance, also shows highly significant differentiation among the regional groups of the transect (φCT = 0.61, p < 0.001, 1000 permutations).
Haplotype diversity
The haplotype median-joining network reflects the four regional clusters found in the phylogenetic analyses (Figs
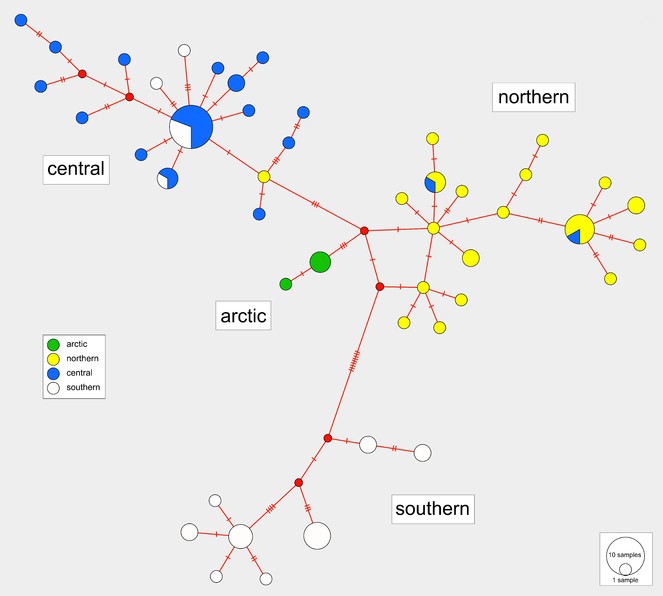
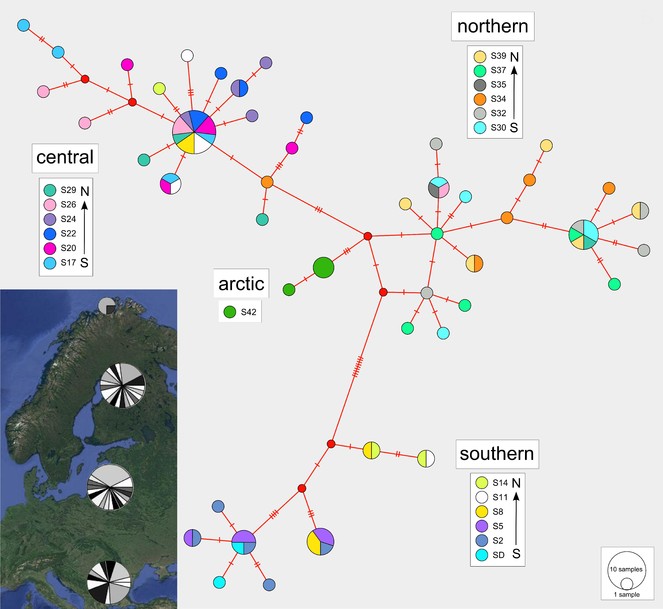
Median-joining haplotype network with colours indicating haplotype distributions by site. Labelled regions (southern, central, northern, arctic) are determined from a ML clade analysis of the DNA sequence data. Inset: Indication of the proportions of haplotypes represented within each of the four major regions.
Isolation by distance
A Mantel test of the correlation between genetic distance (calculated from the DNA sequences) and geographic distance data (calculated from the latitude and longitude coordinates) exhibited high significant positive results (r = 0.5295, p < 0.001). This indicates that genetic similarity declines with increasing geographic distance.
Discussion
Genetic variation
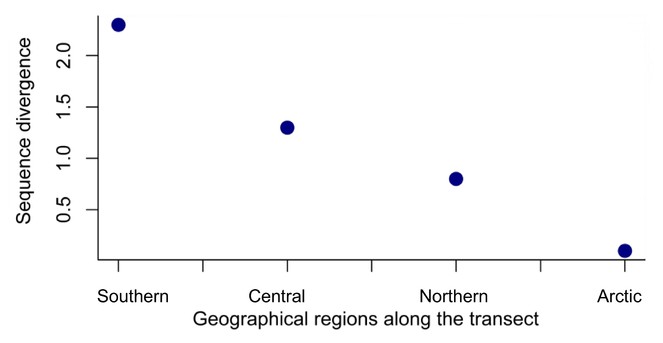
Four regional groups were discovered using genetic analysis and a latitudinal cline of the genetic diversity of these groups is evident with lower genetic diversity at high latitudes. The arctic region has lowest genetic diversity consistent with it being a marginal area of occurrence for the species. Variation of genetic diversity with latitude has been pointed out before [
Genetic structure
High value of φCT indicates that four regional groups across the transect are highly structured with limited gene flow occurring among these groups. Although adult psyllids are winged allowing active migration, biogeographical barriers along the transect possibly restrict gene flow among these four groups. The barrier between southern and central groups (between sites 14 to 17) is coincident with the Carpathian Mountains, a major biogeographic boundary in Europe. The boundary between the central and northern groups (sites 29 to 30) is coincident with the Gulf of Finland, and approximately to the temperate to boreal transition in Europe. Consistent with the general assumption that genetic differentiation increases with increasing geographic distance [
Comparative variation in host plant and associated invertebrates
Urtica dioica has been referred to as an invertebrate “super-host” as this plant provides food and shelter for large numbers of specialist and generalist insects, notably in the Lepidoptera, Coleoptera and Hemiptera [
Conclusions
Despite distinct regional structure in the genetic variation of Trioza urticae, overall genetic divergence, particularly considering the extremely large geographic range, is relatively small (<3%) and is well within intraspecific divergence reported for other psyllid taxa [
Acknowledgements
Funding for the fieldwork was partly provided by the Natural History Museum (London, UK) Life Sciences Departmental Investment Fund (SDF13010) to DP. The molecular work was funded through the UCL Biodiversity, Evolution and Conservation MRes program. QC acknowledges appointments by RBG Kew (as Honorary Research Associate) and by Queen Mary University of London (as Visiting Professor), which greatly facilitated the conduct of this study. We thank our companions in the field, Enrico Ruzzier and Gavin Broad for their invaluable support, and we thank Richard Dee for his expert volunteer contribution sorting specimens. We are grateful to Norman MacLeod for comments on earlier drafts and we thank Igor Malenovský for useful comments that improved the final manuscript.
Author contributions
RW analysed the data and wrote the first version of the paper; QC jointly conceived and planned the study and co-wrote the paper; DP conceived and planned the study, generated the molecular data, assisted in the analysis of data and co-wrote the paper.
References
- Genetic diversity within vertebrate species is greater at lower latitudes.Evolutionary Ecology27:133‑143. https://doi.org/10.1007/s10682-012-9587-x
- Median-joining networks for inferring intraspecific phylogenies.Molecular Biology and Evolution16:37‑48. https://doi.org/10.1093/oxfordjournals.molbev.a026036
- A revised classification of the jumping plant-lice (Hemiptera: Psylloidea).Zootaxa3509:1‑34. https://doi.org/10.11646/zootaxa.3509.1.1
- Salix transect of Europe: patterns in the most abundant chrysomelid beetle (Coleoptera: Chrysomelidae) herbivores of willow from Greece to Arctic Norway.Biodiversity Data Journal4:e10194. https://doi.org/10.3897/bdj.4.e10194
- Salix transect of Europe: latitudinal patterns in willow diversity from Greece to arctic Norway.Biodiversity Data Journal3:e6258. https://doi.org/10.3897/bdj.3.e6258
- Salix transect of Europe: variation in ploidy and genome size in willow-associated common nettle, Urtica dioica L. sens. lat., from Greece to arctic Norway.Biodiversity Data Journal4:e10003. https://doi.org/10.3897/bdj.4.e10003
- The European distribution of insects on stinging nettles, Urtica dioica L.: A field survey.Bolletino di zoologia56(4):321‑326. https://doi.org/10.1080/11250008909355658
- Genetic variation across species’ geographical ranges: the central–marginal hypothesis and beyond.Molecular Ecology17:1170‑1188. https://doi.org/10.1111/j.1365-294x.2007.03659.x
- Geographic Distance Matrix Generator.1.2.3.American Museum of Natural History, Center for Biodiversity and Conservation. Release date:2016-6-20. URL: http://biodiversityinformatics.amnh.org/open_source/gdmg
- Analysis of molecular variance inferred from metric distances among DNA haplotypes: application to human mitochondrial DNA restriction data.Genetics131:479‑91.
- Genetic consequences of climatic oscillations in the Quaternary.Philosophical Transactions of the Royal Society B: Biological Sciences359(1442):183‑195. https://doi.org/10.1098/rstb.2003.1388
- Life cycle variation and adaptation in jumping plant lice (Insecta: Hemiptera: Psylloidea): a global synthesis.Journal of Natural History43:65‑179. https://doi.org/10.1080/00222930802354167
- Isolation by distance, web service.BMC genetics6:13. https://doi.org/10.1186/1471-2156-6-13
- PopART.1.7. URL: http://www.popart.otago.ac.nz
- Multivariate statistical methods: a primer.CRC Press,London,224pp. URL: https://www.crcpress.com/Multivariate-Statistical-Methods-A-Primer-Third-Edition/Manly/p/book/9781584884149 [ISBN9781584884149]
- Creating the CIPRES Science Gateway for inference of large phylogenetic trees.Proceedings of the Gateway Computing Environments Workshop (GCE).2010 Gateway Computing Environments Workshop (GCE),8pp. https://doi.org/10.1109/gce.2010.5676129
- Psyl'list: The World Psylloidea Database. http://www.hemiptera-databases.com/psyllist/. Accessed on: 2016-9-20.
- Radiation, diversity and host plant interactions among island and continental legume-feeding psyllids.Evolution57:2540‑2556. https://doi.org/10.1554/02-558
- Three new species of gall-forming psyllids (Hemiptera: Psylloidea) from Papua New Guinea, with new records and notes on related species.Journal of Natural History50:1073‑1101. https://doi.org/10.1080/00222933.2015.1104394
- Se-Al: sequence alignment editor.2. URL: http://tree.bio.ed.ac.uk/software/seal/
- Latitudinal gradients in species diversity: The search for the primary cause.Oikos65:514‑527. https://doi.org/10.2307/3545569
- Genetic differentiation and estimation of gene flow from F-statistics under isolation by distance.Genetics145:1219‑1228.
- DNA sequencing with chain-terminating inhibitors.Proceedings of the National Academy of Sciences of the United States of America74:5463‑5467.
- Isolation by distance in equilibrium and non-equilibrium populations.Evolution47:264‑279. https://doi.org/10.2307/2410134
- Strong genetic clines and geographical variation in gene flow in the rocky intertidal barnacle Balanus glandula.Molecular Ecology13:2143‑2156. https://doi.org/10.1111/j.1365-294X.2004.02225.x
- RAxML version 8: a tool for phylogenetic analysis and post-analysis of large phylogenies.Bioinformatics30:1312‑1313. https://doi.org/10.1093/bioinformatics/btu033
- PAUP*. Phylogenetic analysis using parsimony (*and other methods).4.Sinauer Associates.
- A new genus and twenty new species of Australian jumping plant-lice (Psylloidea: Triozidae) from Eremophila and Myoporum (Scrophulariaceae: Myoporeae).Zootaxa4073(1):1. https://doi.org/10.11646/zootaxa.4073.1.1
- SequenceMatrix: concatenation software for the fast assembly of multi-gene datasets with character set and codon information.Cladistics27:171‑180. https://doi.org/10.1111/j.1096-0031.2010.00329.x
- Phylogeography of Aglais urticae (Lepidoptera) based on DNA sequences of the mitochondrial COI gene and control region.Molecular Phylogenetics and Evolution31(2):630‑646. https://doi.org/10.1016/j.ympev.2003.09.007
- Isolation by distance.Genetics28:114‑138.