|
Biodiversity Data Journal :
Research Article
|
|
Corresponding author: Giorgos Chatzigeorgiou (chatzigeorgiou@hcmr.gr)
Academic editor: Nikos Minadakis
Received: 20 Oct 2016 | Accepted: 05 Dec 2016 | Published: 21 Dec 2016
© 2016 Giorgos Chatzigeorgiou, Sarah Faulwetter, Thanos Dailianis, Vincent Smith, Panagiota Koulouri, Costas Dounas, Christos Arvanitidis
This is an open access article distributed under the terms of the Creative Commons Attribution License (CC BY 4.0), which permits unrestricted use, distribution, and reproduction in any medium, provided the original author and source are credited.
Citation:
Chatzigeorgiou G, Faulwetter S, Dailianis T, Smith V, Koulouri P, Dounas C, Arvanitidis C (2016) Testing the robustness of Citizen Science projects: Evaluating the results of pilot project COMBER . Biodiversity Data Journal 4: e10859. https://doi.org/10.3897/BDJ.4.e10859
|
|
Abstract
Background
Citizen Science (CS) as a term implies a great deal of approaches and scopes involving many different fields of science. The number of the relevant projects globally has been increased significantly in the recent years. Large scale ecological questions can be answered only through extended observation networks and CS projects can support this effort. Although the need of such projects is apparent, an important part of scientific community cast doubt on the reliability of CS data sets.
New information
The pilot CS project COMBER has been created in order to provide evidence to answer the aforementioned question in the coastal marine biodiversity monitoring. The results of the current analysis show that a carefully designed CS project with clear hypotheses, wide participation and data sets validation, can be a valuable tool for the large scale and long term changes in marine biodiversity pattern change and therefore for relevant management and conservation issues.
Keywords
Coastal biodiversity, Bio-watch, representativeness, robustness
Introduction
A sharply increasing trend in data being gathered by citizen scientists (CSs) without any scientific background has been recorded in the last couple of decades in many different scientific issues. This trend has tremendously facilitated by the platforms developed on the internet, the applications for mobile phones and finally by the popularity and the scope of the SCs activity (
Hundreds of thousands of CSs daily participate to projects related to climate change, invasive species, conservation biology, ecological restoration, water quality monitoring, population ecology and biodiversity monitoring (
The CS projects can be divided into two broad categories: (a) those that they have a scientific approach for the data collection at their hardcore, that is at all those steps from a purely scientific question to the analysis of the data and interpretation of the results and, (b) those that primarily work to address education, outreach and awareness purposes (
Despite the willingness of the individual citizen scientists to collect many data, a crucial point for the success of any CS project is the quality of the datasets they create. One of the main challenges of CS projects from scientific and policy perspective is the quality of the data in terms of accuracy and precision, spatial and temporal resolution, robustness, documetation, and access (
More than 200 CS projects are nowadays active (
A pilot CS project named COMBER (Citizens’ Network for the Observation of Marine BiodivERsity, http://www.comber.hcmr.gr) has been established in the region of the eastern Mediterranean Sea in the context of the ViBRANT (Virtual Biodiversity Research and Access Network for Taxonomy: http://vbrant.eu) project. It has been designed for divers and snorkelers who are interested in participating to coastal marine biodiversity projects. The project aimed at engaging CSs in a marine coastal biodiversity observation network. The main scientific objective of the project has been to test the willingness of SCUBA divers (fun divers or diving club members) to join the project and the quality of the collected data and relevant information.
Therefore, the purpose of this study is to test the robustness and the representativeness of CSs data sets collected in the course of the COMBER project in order to address the marine coastal biodiversity monitoring task based on a single taxon: The most common coastal fish species of the eastern Mediterranean, which is used as a proxy in order to test two hypotheses: (a) The H0 scientific hypothesis on the robustness of the data sets collected during the project, is that there are no differences between the levels of experience of the identifier (CS diver) in the emerging multivariate patterns; in other words, emerging multivariate patterns are independent from the CS data collector and his/her experience; (b) On the issue of the representativeness, the H0 scientific hypothesis, in order for the data collected to be valuable for biodiversity assessment studies, is that the fish species lists of the samples collected by each diver, along with their higher classification (as an approximation of the phylogenetic/taxonomic diversity of a sample), should be random assembly of the broader fish inventories from regional pools. In this way randomness is used a a means to infer representativeness of the collected datasets.
Materials and Methods
Project Description
The pilot COMBER project has been operating in the Aegean Sea, primarily focusing on the Cretan shallow (less than 50m deep) marine habitats, with the potential to expand the concept into the whole Mediterranean basin or any other region (
Data collection
The participants had the option to keep notes for their observations in two ways: presence/absence and relative abundance of four different orders (blank: absent, one bar: 1-3 individuals, two bars: 4-10 individuals and three bars: more than 10 individuals). A short seminar has been provided before each dive excursion, with the view to introduce the SCUBA divers into the concept of the specific CS project. A seminar, of a fifteen minutes presentation, explaining the way of identifying the fish species on the card and how to record them has been delivered before the dive. At the beginning of the dive and for the first ten minutes, participants assisted by the scientists are identifying the different species they can observe and which are depicted on the fish card without recording them. After this ten minutes period, the divers identify and record by themselves. A small de-briefing is following after each dive and all the participants are kindly requested to fill in a questionnaire regarding their past and present experience. Finally, the participants are guided to navigate in the website, create an account, fill in their diving profile and enter their species observations into the database (see for the detailed description of the process in
Statistical analysis
In order to convert the four orders of abundance into numerical values, a new rank with four orders of magnitude was created: absent: 0, one bar: 10 individuals of a certain species, two bars: 100 and three bars: 1000. Additionally, in order to down-weight the differences in divers effort, the abundance values in the recordings of each diver (unique ID) were averaged and then the triangular similarity matrices were produced by applying the Bray-Curtis coefficient using the divers data (rows = species; columns = divers; cells = data). To test the first hypothesis, the multivariate patterns of fish card species distribution were derived by using the algorithm of the non-metric multidimensional scaling (nMDS) on the corresponding similarity matrices as proposed by
The ANOSIM test calculates a sample statistic R with values ranging between -1 and 1 (usually 0-1), where R = 1 represents an undeniable difference between the groups under comparison. The application of the routine in the PRIMER package provides a simulated distribution of possible R values on a frequency histogram and superimposes the observed value on that histogram. Observed R values outside the expected distribution are taken as statistical evidence to reject the null hypothesis (no differences between groups).
Randomization Test
To test the second hypothesis, that is whether the fish species lists recorded by the divers, based on the use of the fish-card (that is the most common eastern Mediterranean shallow fishes), are randomly assembled from the fish species pool of the broader area, a hierarchical approach was applied. Six different scales of observation are defined after an extended literature research: (a) Mediterranean fish inventory (b) Eastern Mediterranean fish inventory, (c) Aegean fish inventory, (d) down to 50m depth Mediterranean fish inventory, (e) down to 50m Eastern Mediterranean and (f) down to 50m Aegean. The last three of the aforementioned scales were specifically chosen because of the use of the "bio-watch" fish card created for divers and snorkelers and thus all the included species live in shallow waters and therefore are observable. For the construction of observational species list the data base from FishBase was used (www.fishbase.org). The test was run for the two different categories of data set based on: a) diving experience and b) identification experience. At each scale of comparison it was tested whether the biodiversity observation subsets, which means the species lists recorded by the divers and their higher phylogenetic interrelations, represent a random sample of the higher observational scales. The above test was performed by calculating the taxonomic distinctness indices (average taxonomic distinctness, Δ+ and, variation in taxonomic distinctness, Λ+). These indices take into account not only species ID but also their phylogenetic / taxonomic interrelations (e.g.
The theoretical background for this approach is based on
Results
In total 141 divers and snorkelers (unique ID) have participated in the COMBER pilot project. The participants have submitted 365 data sets (5,600 observations) within the three years of the pilot project implementation. More than half of the participants (61%) contribute to the database at least twice, with the highest record 28 entries from the same participant. The most common species found to be the Coris julis (256 / 365) while the less abundant was Raja clavata (1/365).
Do groups of observations differ?
The MDS plots (Fig.
Results of the one-way ANOSIM testing for differences among Factors: Diving Experience (Goup1: Amateur, Group2: Skilled, Group3: Professional), Identification Experience (Goup1: Novice, Group2: Intermediate, Group3: Experienced) and Years of Implementation (Goup1: 2011, Group2: 2012, Group3: 2013)
|
Diving Exp |
Identification Exp |
Years Impement |
||||
|
Factors |
R value |
P |
R value |
P |
R value |
P |
|
Total |
0.015 |
0.172 |
0.057 |
0.341 |
0.115 |
0.396 |
|
Group1 , Group2 |
0.014 |
0.173 |
-0.036 |
0.222 |
0.034 |
0.329 |
|
Group2 , Group3 |
0.016 |
20.8 |
0.214 |
0.231 |
0.235 |
0.365 |
|
Group3 , Group1 |
0.006 |
0.308 |
0.55 |
0.421 |
0.12 |
0.317 |
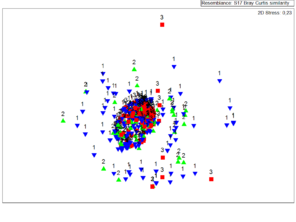
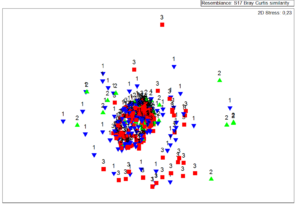
MDS plots showing the similarities in recorded species lists between groups differing in: (a) identification experience and, (b) diving experience. Sample labels: a) 1: amateur, 2: skilled, 3: professional and, b) 1: novice, 2: intermediate, 3: experienced.
b: Diving Experience
Is the dataset representative and if yes to what extent?
A summary of the results from the tests for both taxonomic distinctness indices (Δ+, Λ+) at all scales of observation are shown in (Fig.
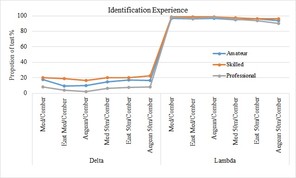
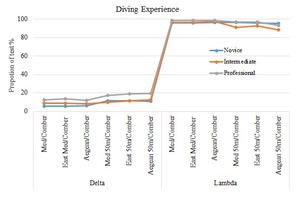
Summary of randomisation test at all levels of observation for both indices (Λ+, Δ+). Values on the y-axis show the percentage of species lists for which values from calculated indices fall within the 95% confidence limits of the simulated funnel. The values are calculated from the species list on fish card and the funnel from the species list at the higher observational scales as denoted on the labels of the x-axis for the two categories of analysis a) Identification Experience and b) Diving Experience
b: Diving Experience
Discussion
Citizen science projects are booming undoubtedly, however the crucial question about the reliability of the datasets has not yet been fully clarified. The scientific effort of COMBER project attempts to shed some light onto whether the collected data sets have a scientific value and if yes to what extend (e.g.
The performance of the MDS technique produces a broadly scattered and without a clear distinction pattern between the datasets collected from the two broad categories of analysis (diving and identification experience) and between the years of the project initial implementation. The analysis of similarities shows that there are no statistical differences between the produced data sets in reference with the collection years, diving experience and identification skills. At this point must be underline that the stress values on both analysis (diving and identification experience) were greater than the crucial value 0.2. Based on
With the analysis of representativeness we test whether the species lists from fish card in the collected data sets are representative of the Mediterranean region. The results from taxonomic distinctness indices have shown an opposite pattern: (a) The Δ+ funnels show that at all levels of observation and for all different categories of divers the majority of the datasets fall outside the expected distribution; (b) This pattern is altered in case of Λ+ index funnels, where the majority of the participant’s datasets fall inside the funnels limits. Taking into account the theoretical background and the mathematical formula of the two indices it’s easy to explain the converse patterns obtained from both of them. There is an undeniable bias in the fish card species list and their higher classification since at least two fish families (Sparidae and Labridae) are over-represented. These two families are, indeed, very common in the shallow coastal Mediterranean waters (
Questions on large scale long term biodiversity patterns and their changes can be answered through CS projects. The collection of such data by exclusively scientists requires a vast amount of budget and effort. In addition, the large number of publications (US Breeding Bird Survey and Christmas Bird Count have resulted in over 500 and 300 publications, respectively; (
Citizen’s participation in marine CS projects is limited comparing with the terrestrial one. The main reason for this “unbalanced representation” is the accessibility and the associated costs, which are more direct and lower, repectively, in the case of terrestrial activities. Volunteers who dropping out or becoming disinterested could possibly be convinced to come back with some degree of positive reinforcement (i.e., informing them how they are impacting conservation) (
At this point, it must be underlined that the citizen scientists have to be categorized in different groups, based on their contribution in the projects: a) basic level, where participants contribute only in data gathering, b) advanced level, where participants, may make suggestions and try to improve the purpose of the project and, c) professional level, where participants are involved in the setup of the project (
To conclude, CS projects become an increasing need for biodiversity monitoring by collecting large scale, long term data. Until now, the results of existing projects have shown that the collected data have to some extent an important scientific value if they are analyzed in the proper way. Most of the already running projects show that volunteers are able to detect important changes in communities through their data and so they have a valuable role to play in assessing change on biodiversity and ecosystems (
Acknowledgements
The authors are much indebted to the owners of the following diving clubs: (a) Happy Divers, Agios Nikolaos (Mr. Nikolaos Koutoulakis), (b) European Diving Institute, Lygaria (Mr. Michalis Kanakakis) (C) Lesvos Scuba Oceanic Centre, Lesvos (Mr. Georgios Filios) and the sailing club: Altersail (Mr. Nikolaos Vitsaxakis). Finally, all the divers who participated in this pilot project (10.3897/zookeys.150.2149) are specially thanked for their efforts and enthusiasm. Part of the analysis was supported by the EU BON project (Grand Agreement number 308454).
References
- Engaging the broader community in biodiversity research: the concept of the COMBER pilot project for divers in ViBRANT.ZooKeys150:211‑29. https://doi.org/10.3897/zookeys.150.2149
- Statistical solutions for error and bias in global citizen science datasets.Biological Conservation173:144‑154. https://doi.org/10.1016/j.biocon.2013.07.037
- Citizen Science: A Developing Tool for Expanding Science Knowledge and Scientific Literacy.BioScience59(11):977‑984. https://doi.org/10.1525/bio.2009.59.11.9
- The science of citizen science: Exploring barriers to use as a primary research tool.Biological ConservationN/A.
- Making marine and coastal citizen science matter.Ocean & Coastal Management115:77‑87. https://doi.org/10.1016/j.ocecoaman.2015.06.012
- Similarity-based testing for community pattern: the two-way layout with no replication.Marine Biology118(1):167‑176. https://doi.org/10.1007/bf00699231
- Citizen science as a tool for conservation in residential ecosystems.Ecology and Society12.
- Citizen-science programs: Towards transformative biodiversity governance.Environmental Development13:39‑45. https://doi.org/10.1016/j.envdev.2014.11.003
- Online citizen science games: Opportunities for the biological sciences.Applied & Translational Genomics3(4):90‑94. https://doi.org/10.1016/j.atg.2014.07.001
- Citizen Science as an Ecological Research Tool: Challenges and Benefits.Annual Review of Ecology, Evolution, and Systematics41(1):149‑172. https://doi.org/10.1146/annurev-ecolsys-102209-144636
- Mediterranean coastal fishes: an illustrated snorkeler’s guide.Kaleidoskope – BIOWATCH Editors,Heraklion - Crete,100+xxpp. [InGreek].
- Citizen science comes of age.Trends in Ecology & Evolution28(8):451. https://doi.org/10.1016/j.tree.2013.05.003
- Comparing monitoring data collected by volunteers and professionals shows that citizen scientists can detect long-term change on coral reefs.Journal for Nature Conservation24:1‑9. https://doi.org/10.1016/j.jnc.2015.01.002
- Predicting long-term changes in marine benthic communities.Marine Ecology Progress Series13:87‑94. https://doi.org/10.3354/meps013087
- Can citizen science contribute to the evidence-base that underpins marine policy?Marine Policy59:112‑120. https://doi.org/10.1016/j.marpol.2015.04.022
- Network environmentalism: Citizen scientists as agents for environmental advocacy.Global Environmental Change29:235‑245. https://doi.org/10.1016/j.gloenvcha.2014.10.006
- Evaluating the Quality of Citizen-Scientist Data on Pollinator Communities.Conservation Biology25(3):607‑617. https://doi.org/10.1111/j.1523-1739.2011.01657.x
- Multidimensional scaling by optimizing goodness of fit to a nonmetric hypothesis.Psychometrika29(1):1‑27. https://doi.org/10.1007/bf02289565
- Why most conservation monitoring is, but need not be, a waste of time.Journal of environmental management78(2):194‑9. https://doi.org/10.1016/j.jenvman.2005.04.016
- Linking place-based citizen science with large-scale conservation research: A case study of bird-building collisions and the role of professional scientists.Biological Conservation184:439‑445. https://doi.org/10.1016/j.biocon.2015.02.023
- An evaluation of a citizen science data collection program for recording wildlife observations along a highway.Journal of Environmental Management139:180‑187. https://doi.org/10.1016/j.jenvman.2014.02.018
- Invasive alien predator causes rapid declines of native European ladybirds.Diversity and Distributions18(7):717‑725. https://doi.org/10.1111/j.1472-4642.2012.00883.x
- Mapping stakeholder values for coastal zone management.Marine Ecology Progress Series434:239‑249. https://doi.org/10.3354/meps09136
- A new dawn for citizen science.Trends in Ecology & Evolution24(9):467‑471. https://doi.org/10.1016/j.tree.2009.03.017
- Assessing evidence for random assembly of marine benthic communities from regional species pools.Marine Ecology Progress Series382:279‑286. https://doi.org/10.3354/meps07934
- Global change and local solutions: Tapping the unrealized potential of citizen science for biodiversity research.Biological Conservation181:236‑244. https://doi.org/10.1016/j.biocon.2014.10.021
- Realising the full potential of citizen science monitoring programs.Biological Conservation165:128‑138. https://doi.org/10.1016/j.biocon.2013.05.025
- New " biodiversity " measures reveal a decrease in taxonomic distinctness with increasing stress.Marine Ecology Progress Series129:301‑305. https://doi.org/10.3354/meps129301
- Practical measures of marine biodiversity based on relatedness of species.Oceanography Marine Biology Annual Review39:207‑231.
- Establishing the Canadian Community Monitoring Network.Environmental monitoring and assessment88:409‑18. https://doi.org/10.1023/A:1025545813057
- SCUBA divers as oceanographic samplers: The potential of dive computers to augment aquatic temperature monitoring.Scientific Reports6:30164. https://doi.org/10.1038/srep30164