|
Biodiversity Data Journal :
General research article
|
Usage patterns of blue flower color representation by Encyclopedia of Life content providers
|
Corresponding author:
Academic editor: Anne Thessen
Received: 09 Jun 2014 | Accepted: 07 Aug 2014 | Published: 11 Aug 2014
© 2014 Chantal-Marie Wright, Katja Seltmann
This is an open access article distributed under the terms of the Creative Commons Attribution License (CC BY 4.0), which permits unrestricted use, distribution, and reproduction in any medium, provided the original author and source are credited.
Citation:
Wright C, Seltmann K (2014) Usage patterns of blue flower color representation by Encyclopedia of Life content providers. Biodiversity Data Journal 2: e1143. https://doi.org/10.3897/BDJ.2.e1143
|
|
Abstract
Encyclopedia of Life (EOL) is a resource for community-driven biodiversity data, focusing on species information and images. Research into blue flowers to compare color ('blueness') at different elevations revealed that data content providers describe flowers as blue for any color hue in the range from blue to magenta. We propose methods for standardizing color values and color searching within EOL by means of an expanded color vocabulary and improved access to image metadata, in order to improve the research capacity of this valuable resource.
Keywords
Encyclopedia of Life, TraitBank, color models and analysis, user phenotype annotation, Phenotypic Quality Ontology
Introduction
The stated mission of Encyclopedia of Life (
Several prior studies noted the prevalence of blue flowers in high elevation areas (
Material and methods
Data Acquisition
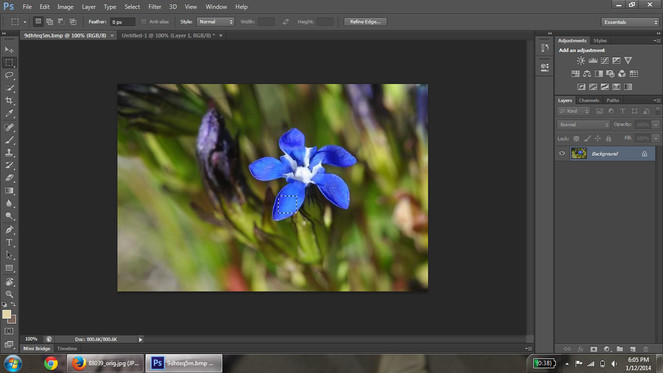
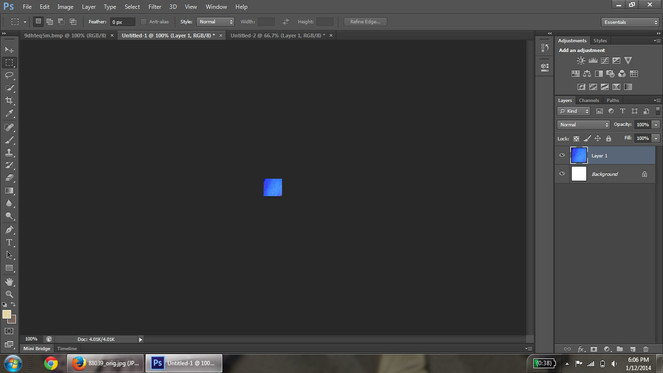
Images used in the analysis were retrieved from the Encyclopedia of Life (EOL;
Data Analysis
Data analysis and graphing were performed using R statistical software (
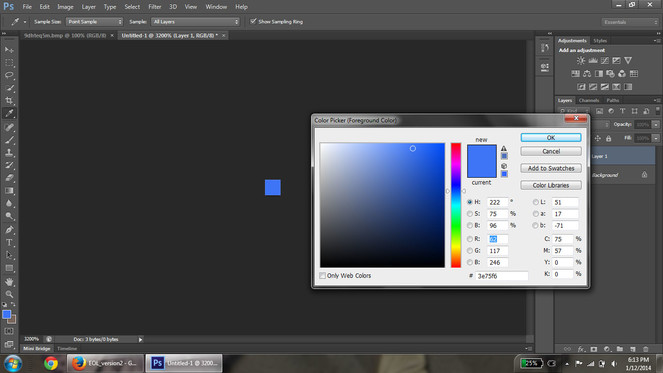
Color values were converted from Red, Green, Blue color model (RGB) to Hue, Saturation, and Value color model (HSV). Conversion was accomplished using the rgbtohsv library in the R package grDevices version 2.13.1 (
The basic color hue representations discussed above are outlined in Table
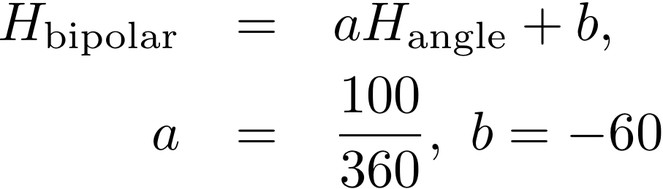
Values for the principle colors of interest as represented in RGB, HSV, Hbipolar color models and PATO URI.
| Color label | RGB | HSV (Hdegree, S%, V%) | Hbipolar | PATO Identifier |
|---|---|---|---|---|
| red | 255,0,0 | 0°,100%,100% | 40/-60 | http://purl.obolibrary.org/obo/PATO_0000322 |
| magenta | 255,0,255 | 300°,100%,100% | 20 | http://purl.obolibrary.org/obo/PATO_0000321 |
| purple | 128,0,128 | 300°,100%,50% | 20 | http://purl.obolibrary.org/obo/PATO_0000951 |
| blue | 0,0,255 | 240°,100%,100% | 7 | http://purl.obolibrary.org/obo/PATO_0000318 |
| cyan | 0,255,255 | 180°100%,100% | -10 | http://purl.obolibrary.org/obo/PATO_0000319 |
| green | 0,255,0 | 120°,100%,100% | -30 | http://purl.obolibrary.org/obo/PATO_0000320 |
| yellow | 255,255,0 | 60°,100%,100% | -43 | http://purl.obolibrary.org/obo/PATO_0000324 |
| orange | 255,128,0 | 30°,100%,100% | -52 | http://purl.obolibrary.org/obo/PATO_0000953 |
Phenotypic Quality Ontology Uniform Resource Identifiers (URI) are mapped to each hue value. The modifications to existing PATO definitions necessary to fully describe image hues were formally proposed for inclusion in the PATO ontology via the Open Biomedical Ontology SourceForge request account (https://sourceforge.net/p/obo/phenotypic-quality-pato-requests). Additionally, terminology was proposed to represent intermediate color value ranges, and Encyclopedia of Life URI are assigned to these terms at the present time. Each proposed color term corresponds to a range of values between primary hues as in the example of Fig.
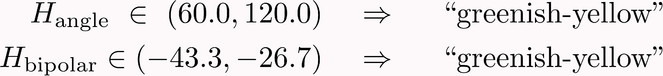
The range, or intermediate values, between primary Hues (i.e. red, magenta, purple, blue, cyan, green, yellow, and orange) can be represented in Hdegree, Hbipolar or using natural language terms. The representations for the hue range values are outlined in Table
Range hue values for proposed intermediate colors as represented in RGB, HSV, Hbipolar color models, and PATO or EOL URI.
| Color | Hdegree Range | Hbipolar Range | EOL or PATO Identifier |
|---|---|---|---|
| greenish-yellow | 60°,120° | -43,-27 | http://purl.obolibrary.org/obo/PATO_0001941 |
| yellowish-orange | 30°,60° | -51,-43 | http://purl.obolibrary.org/obo/PATO_0001944 |
| orangish-red | 0°,30° | -60(0),-51 | http://eol.org/schema/terms/orangish-red |
| reddish-purple | 300°,360° | 23,-60(0) | http://eol.org/schema/terms/reddish-purple |
| purplish-blue | 240°,300° | 7,23 | http://eol.org/schema/terms/purplish-blue |
| bluish-green | 120°,240° | -27,7 | http://eol.org/schema/terms/bluish-green |
Results
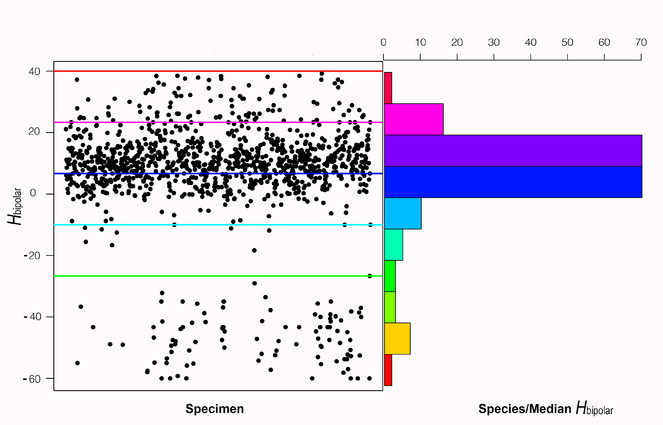
Searching for "blue flowers" from the EOL search interface resulted in 1165 images representing unique specimens, and 182 unique species. 33 species recovered have a common name that contains the word "blue". The reminder of the 149 species were retrieved because the word "blue" occurred somewhere in the description. Based on the analysis described above, records returned using the color name "blue" presented a spectrum of flower colors spanning all angles of the color wheel (Fig.
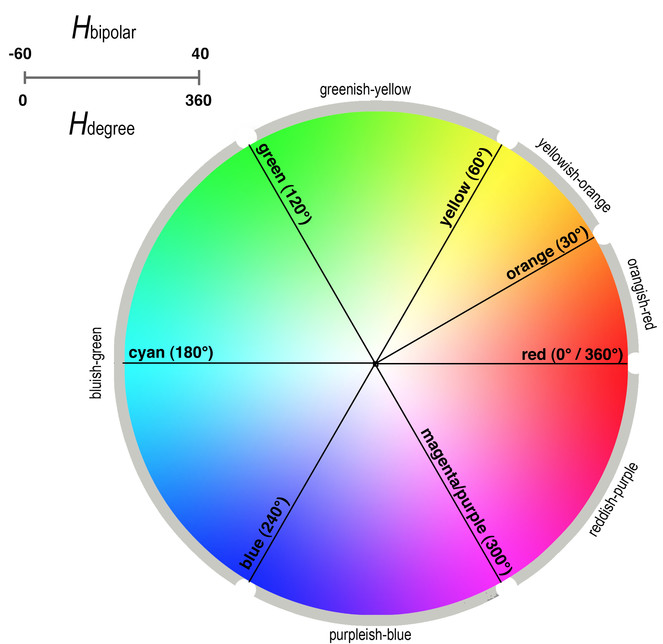
Fig.
Discussion
The Encyclopedia of Life (EOL) collects images from individual users and from online "Content Partners". These Content Partners are varied, ranging from museums and government divisions such as US Fish and Wildlife Service (http://www.fws.gov), to open-access, community driven websites like Flickr (http://www.flickr.com). We surmised from this investigation that, at the present time, researching phenotype data utilizing the present EOL interface is difficult. This is not an observation unknown to EOL, as demonstrated by the recent inclusion of the TraitBank software (
The ability to control and standardize imaging techniques in as large a resource as EOL is challenging, and this study expected to find variation in flower color within a single species, based on image quality or intraspecific variation. We suggest that the study of color based on EOL images would benefit from the ability to easily access original images that contain color profile information embedded within the image metadata. Color profile information, found in the Exchangeable image file format (Exif), may improve the accuracy of color analysis, as it contains information about the image and camera settings when the photograph was taken (
A final suggestion for stimulating scientific research utilizing EOL is to encourage data providers to include geo-coordinates for images, as each image is a representation of an individual occurrence of a species. These could be provided either manually or through Exif metadata. For this study, USDA PLANTS was used to acquire the native range of species whose native ranges could not be found in the taxon information available on EOL. However, general species ranges are often vague and typically do not include enough detail concerning specific environmental conditions of the specimen for ecological inference.
A new feature on EOL, released near the end of this project, is the TraitBank. TraitBank is a "searchable comprehensive, open digital repository for organism traits, measurements, interactions and other facts for all taxa across the tree of life" (http://eol.org/traitbank). This novel search tool offers selected search criteria for a number of phenotype attributes. Flower color is one of the searchable traits, with "blue" on EOL being defined sensu PATO. The color annotation originates from the USDA PLANTS database characteristics list, which compiles data "from the scientific literature, gray literature, agency documents, and the knowledge of plant specialists" (http://www.fws.gov, 2013). At the present time, only 8 color options exist on USDA PLANTS (blue, brown, green, orange, purple, red, white and yellow). USDA PLANTS do not define these colors, while EOL appends the PATO definitions. These definitions, while helpful, are still limited. Photoshop displays RGB values using a scale of 0-255. 8-bit images (such as a .jpg file) have 256 possible brightness values, and Photoshop continues to use this standard today. The PATO ontology bases its definitions on color wavelength. Unfortunately, there is no easy or accurate conversion between colors as defined by PATO and color in a Hue, Saturation and Value (HSV) representation as there is no unique mapping between wavelength and RGB. Additionally, some RGB values may be a representation of multiple wavelengths (
Data from this study indicates that the majority of the images sampled have hue values that fall above blue towards magenta, into what might be called "purple" hue rather than "blue" hue. The ability to tag images with a structured vocabulary that includes suggestions of intermediate ranges like "purplish" or "blueish-purple" to differentiate among the colors that fall between magenta and blue rather than magenta and red would be helpful in clarifying color descriptions. We suggest the adoption of a Color Naming System (CNS) terminology with HSV or RGB intermediate values. Assigning natural language terms to discrete ranges of hue values could be used to convert the results from an automatic color picker tool to terms more easily understood by image describers. Further support for the adoption of an expanded color naming system exists in the literature. Berk et al. (1982) demonstrated users annotating colors using RGB, Hue, Saturation and Lightness (HSL) and the Color Naming System (CNS), based on the color lexicon used by the Inter-Society Color Council (ISCC –
As a further result of this investigation, the image hue value annotations, in the form of a EOL or PATO URI, were returned to EOL TraitBank based on our analysis. Stable URIs associated with ontology classes make it plausible to share phenotype information captured in publication intelligently through the Web (
Conclusion
In conclusion, this study revealed that searching for "blue" flowers on EOL returned images that when analyzed represented color values that range from blue to magenta. The PATO terms presently available for use by EOL include violet, blue, cyan, green, purple, light blue, dark blue, and saturated blue in the range of blue descriptors. Studies have shown that humans may be able to best represent color in textual descriptions that include more nuanced variation (i.e. greenish-blue, bluish-purple) than is currently available through PATO. We propose to extend PATO (Suppl. material
Acknowledgements
The authors would like to acknowledge Dr. Yon Visell for his insightful discussions on color model calculations. This study was made possible by funding and support from The Encyclopedia of Life, EOL Rubenstein Fellows Program and the David M. Rubenstein Grant (CRDF #EOL-33066-13/G33066), Smithsonian Institution. Support was also provided by CRDF Global. Materials and infrastructure support were provided by Tri-Trophic Thematic Collections Network (National Science Foundation grant ADBC#1115144) and the American Museum of Natural History.
Author contributions
Conceived and designed the experiments: KCS CMW. Performed the experiments: CMW KCS. Analyzed the data: KCS CMW. Contributed reagents/materials/analysis tools: CMW KCS. Wrote the paper: KCS CMW.
References
- Adobe Photoshop CS6 Extended.Version 13.0 x64. Release date:2012-5-07.
- A human factors study of color notation systems for computer graphics.Communications of the ACM25(8):547‑550. https://doi.org/10.1145/358589.358606
- Berns RS, Billmeyer FW, Saltzman M (2000) Measuring color. Billmeyer and Saltzman principles of color technology.John Wiley,New York,75-105pp.
- Pollinators of the Rocky Mountain columbine: temporal variation, functional groups and associations with floral traits.Annals of Botany103(9):1567‑1578. https://doi.org/10.1093/aob/mcp096
- Using ontologies to describe mouse phenotypes.Genome Biology6(1):R8. https://doi.org/10.1186/gb-2004-6-1-r8
- Automatically Annotating Images with Keywords: A Review of Image Annotation Systems.Recent Patents on Computer Science1(1):55‑68. https://doi.org/10.2174/2213275910801010055
- TraitBank: Practical semantics for organism attribute data (in prep).Semantic Web Journal0:0.
- The Encyclopedia of Life v2: Providing Global Access to Knowledge About Life on Earth. (submitted).Biodiversity Data Journale1079:0. https://doi.org/10.3897/BDJ.2.e1079
- R: A Language and Environment for Statistical Computing.R Foundation for Statistical Computing,Vienna, Austria,0pp. URL: http://www.R-project.org [ISBN3-900051-07-0]
- Pixels, bits, and GUIs: The fundamentals of digital imagery and their application by plant pathologists.Plant disease88(3):228‑241. https://doi.org/10.1094/PDIS.2004.88.3.228
- A hymenopterists' guide to the Hymenoptera Anatomy Ontology: utility, clarification, and future directions.Journal of Hymenoptera Research27:67‑88. https://doi.org/10.3897/jhr.27.2961
- Simon F (1997) Color Order. In: Colorists AAoTCa Color technology in the textile industry.179-180pp.
- Color gamut transform pairs.ACM SIGGRAPH Computer Graphics12(3):12‑19. https://doi.org/10.1145/965139.807361
- USDA NNPDT (2014) The PLANTS Database. [website].Greensboro, NC 27401-4901 USA. URL: http://plants.usda.gov
- Flower colours and their frequency.Acta Botanica Neerlandica1:81‑92. https://doi.org/10.1111/j.1438-8677.1952.tb00002.x
Supplementary materials
Final scripts and graph methods for figures represented in this study.
Master Excel file with metadata about the image. Also includes metadata about the specific imaged specimen, or generalized species metadata when specimen data is not available.
Data field definitions for the master Excel file (Document 2).
Tab delimited text file used in R scripts.
RGB values recovered from point analysis of images. Used in R scripts to convert to HSV.
URIs and definitions of hues as defined by PATO ontology or defined by authors. These terms were proposed for inclusion in PATO, or edits to existing definitions in PATO. Where PATO URIs were not available eol identifiers were included.