|
Biodiversity Data Journal :
General research article
|
|
Corresponding author:
Academic editor: Ross Mounce
Received: 09 Apr 2015 | Accepted: 06 May 2015 | Published: 12 May 2015
© 2015 Jeremy Miller, Donat Agosti, Lyubomir Penev, Guido Sautter, Teodor Georgiev, Terry Catapano, David Patterson, David King, Serrano Pereira, Rutger Vos, Soraya Sierra
This is an open access article distributed under the terms of the Creative Commons Attribution License (CC BY 4.0), which permits unrestricted use, distribution, and reproduction in any medium, provided the original author and source are credited.
Citation:
Miller J, Agosti D, Penev L, Sautter G, Georgiev T, Catapano T, Patterson D, King D, Pereira S, Vos R, Sierra S (2015) Integrating and visualizing primary data from prospective and legacy taxonomic literature. Biodiversity Data Journal 3: e5063. https://doi.org/10.3897/BDJ.3.e5063
|
|
Abstract
Specimen data in taxonomic literature are among the highest quality primary biodiversity data. Innovative cybertaxonomic journals are using workflows that maintain data structure and disseminate electronic content to aggregators and other users; such structure is lost in traditional taxonomic publishing. Legacy taxonomic literature is a vast repository of knowledge about biodiversity. Currently, access to that resource is cumbersome, especially for non-specialist data consumers. Markup is a mechanism that makes this content more accessible, and is especially suited to machine analysis. Fine-grained XML (Extensible Markup Language) markup was applied to all (37) open-access articles published in the journal Zootaxa containing treatments on spiders (Order: Araneae). The markup approach was optimized to extract primary specimen data from legacy publications. These data were combined with data from articles containing treatments on spiders published in Biodiversity Data Journal where XML structure is part of the routine publication process. A series of charts was developed to visualize the content of specimen data in XML-tagged taxonomic treatments, either singly or in aggregate. The data can be filtered by several fields (including journal, taxon, institutional collection, collecting country, collector, author, article and treatment) to query particular aspects of the data. We demonstrate here that XML markup using GoldenGATE can address the challenge presented by unstructured legacy data, can extract structured primary biodiversity data which can be aggregated with and jointly queried with data from other Darwin Core-compatible sources, and show how visualization of these data can communicate key information contained in biodiversity literature. We complement recent studies on aspects of biodiversity knowledge using XML structured data to explore 1) the time lag between species discovry and description, and 2) the prevelence of rarity in species descriptions.
Keywords
Araneae, Biodiversity informatics, Data mining, Open access, Spiders, Taxonomy, XML markup
Introduction
The limited accessibility of taxonomic literature is an impediment not only to taxonomic research but to the effective functioning of the biodiversity classification system that underlies biology (
To facilitate the aggregation and re-use of knowledge from taxonomic literature, the Swiss NGO Plazi (http://www.plazi.org/) has established a treatment bank that stores structured versions of taxonomic treatments marked up with XML (TaxonX schema, http://taxonx.org/). Taxonomic treatments are any descriptive or diagnostic contributions that add to our understanding of the taxonomy or nomenclature of that taxon (
Fine-grained XML markup of legacy taxonomic literature allows us to experiment with new approaches to synthesizing the primary data that are the foundation of taxonomic research. During pro-iBiosphere’s Data Enrichment Hackathon (http://wiki.pro-ibiosphere.eu/wiki/Data_enrichment_hackathon,_March_17-21_2014;
Spiders (Order: Araneae) are the seventh most speciose order of life on earth and an important megadiverse taxon in biodiversity studies (
GBIF (the Global Biodiversity Information Facility - www.gbif.org) aggregates and serves occurrence data through a common portal. These data are applicable to a wide range of fields at the intersection of biodiversity, geography, and climate. To serve researchers in these fields requires that we plot species distributions, predict impacts from climate change, track invasive alien species, set informed conservation priorities, and more (http://www.gbif.org/usingdata/sciencerelevance). A leading mechanism for getting content into GBIF involves aggregating data from a network of large institutional collections, especially natural history collections. With more than half a billion records already available through GBIF, it might seem that a fine-grained markup process capable of adding occurrences is redundant. Yet, if we break down GBIF data by taxon, some strong patterns and biases emerge (Fig.
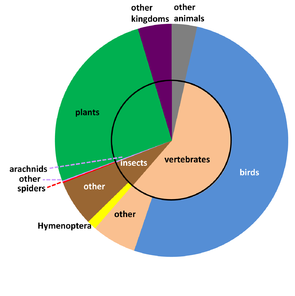
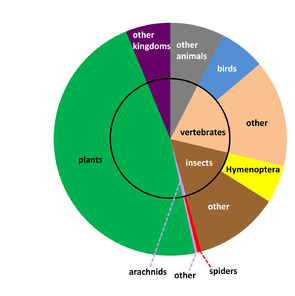
GBIF records proportioned by selected taxonomic groups (Suppl. material
b: Specimen-based records in GBIF (n = 98,144,242).
In its short 14-year history, Zootaxa has published more articles on spider taxonomy than any other journal (World Spider Catalog 2014; Fig.
Open access articles in Zootaxa containing treatments on spiders (Araneae) as of August 2014. For each article, the page count, number of treatments (species rank, higher rank, and total), number of specimens, DOI, and Zoobank LSID (where available) are specified.
| Source | Page count | Species treatments | Higher treatments | Total treatments | Specimens | DOI | Zoobank LSID |
|---|---|---|---|---|---|---|---|
|
|
14 | 2 | 2 | 4 | 36 | 10.11646/zootaxa.3857.1.8 | urn:lsid:zoobank.org:pub:8906CCE0-C5CC-4142-A9AF-98DA4BC953AF |
|
|
20 | 6 | 2 | 8 | 23 | 10.11646/zootaxa.3768.2.2 | urn:lsid:zoobank.org:pub:B200DE30-D839-4107-A240-7DFB87A75635 |
|
|
4 | 1 | 1 | 2 | 1 | 10.11646/zootaxa.3750.2.8 | urn:lsid:zoobank.org:pub:9515170F-60D0-43D3-A936-81E16EBEE6C3 |
|
|
23 | 19 | 7 | 26 | 172 | 10.11646/zootaxa.3666.2.4 | urn:lsid:zoobank.org:pub:FE211811-36E2-4A22-A55B-6E080E5CEC1D |
|
|
6 | 4 | 1 | 5 | 13 | 10.11646/zootaxa.3664.1.4 | urn:lsid:zoobank.org:pub:39F277A8-C7EB-4433-A87F-76A843CB1985 |
|
|
6 | 1 | 1 | 2 | 4 | 10.11646/zootaxa.3646.5.8 | urn:lsid:zoobank.org:pub:50C87148-49F6-4BB2-BBF3-B5E6DD52B282 |
|
|
19 | 2 | 1 | 3 | 274 | 10.11646/zootaxa.3507.1.2 | urn:lsid:zoobank.org:pub:8EDE33EB-3C43-4DFA-A1F4-5CC86DED76C8 |
|
|
21 | 13 | 0 | 13 | 65 | 10.11646/33 | |
|
|
24 | 4 | 1 | 5 | 304 | 10.11646/zootaxa.3383.1.3 | |
|
|
25 | 6 | 2 | 8 | 118 | 10.11646/zootaxa.3305.1.2 | |
|
|
8 | 3 | 0 | 3 | 3 | 10.11646/zootaxa.3228.1.3 | |
|
|
34 | 7 | 1 | 8 | 1978 | 10.11646/zootaxa.3131.1.1 | |
|
|
14 | 1 | 0 | 1 | 46 | 10.11646/zootaxa.2963.1.3 | |
|
|
4 | 1 | 0 | 1 | 4 | 10.11646/zootaxa.2883.1.5 | |
|
|
18 | 2 | 1 | 3 | 15 | 10.11646/zootaxa.2814.1.1 | |
|
|
10 | 2 | 2 | 4 | 80 | 10.11646/zootaxa.2739.1.4 | |
|
|
21 | 13 | 3 | 16 | 41 | 10.11646/zootaxa.2730.1.2 | |
|
|
24 | 8 | 1 | 9 | 160 | 10.11646/zootaxa.2637.1.2 | |
|
|
127 | 60 | 0 | 60 | 730 | 10.11646/zootaxa.2593.1.1 | |
|
|
4 | 1 | 1 | 2 | 3 | 10.11646/zootaxa.2551.1.3 | |
|
|
36 | 9 | 2 | 11 | 133 | 10.11646/zootaxa.2534.1.1 | |
|
|
17 | 7 | 4 | 11 | 6 | 10.11646/zootaxa.2526.1.2 | |
|
|
11 | 1 | 0 | 1 | 2 | 10.11646/zootaxa.2427.1.3 | |
|
|
12 | 7 | 1 | 8 | 54 | 10.11646/zootaxa.2361.1.1 | |
|
|
4 | 1 | 0 | 1 | 45 | 10.11646/zootaxa.2267.1.5 | |
|
|
23 | 3 | 0 | 3 | 48 | 10.11646/zootaxa.2223.1.2 | |
|
|
14 | 3 | 1 | 4 | 38 | 10.11646/zootaxa.1826.1.3 | |
|
|
24 | 5 | 1 | 6 | 54 | 10.11646/zootaxa.1775.1.1 | |
|
|
10 | 2 | 1 | 3 | 99 | 10.11646/zootaxa.1744.1.3 | |
|
|
12 | 3 | 1 | 4 | 39 | 10.11646/zootaxa.1529.1.4 | |
|
|
11 | 3 | 0 | 3 | 67 | 10.11646/zootaxa.1425.1.1 | |
|
|
14 | 1 | 2 | 3 | 33 | 10.11646/zootaxa.1004.1.2 | |
|
|
19 | 5 | 0 | 5 | 80 | 10.11646/zootaxa.904.1.1 | |
|
|
19 | 2 | 2 | 4 | 51 | 10.11646/zootaxa.872.1.1 | |
|
|
14 | 1 | 0 | 1 | 42 | 10.11646/zootaxa.619.1.1 | |
|
|
8 | 1 | 0 | 1 | 1 | 10.11646/zootaxa.445.1.1 | |
|
|
8 | 1 | 0 | 1 | 10 | 10.11646/zootaxa.109.1.1 |
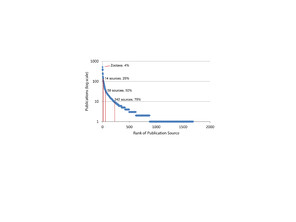
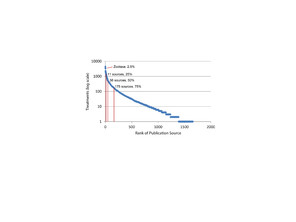
Number of publications (a; Suppl. material
b: The 2014 World Spider Catalog refers to 126,621 treatments. With 3314 treatments (2.6%), Zootaxa is the third ranking all time venue behind two museum monograph series: Bulletin of the American Museum of Natural History (4537 treatments, 3.6%) and Harvard's Bulletin of the Museum of Comparative Zoology (3761 treatments, 3.0%).
Pensoft was the first publisher to distribute semantic content to online taxonomic resources and databases as a routine part of the publication process, starting with Encyclopedia of Life (http://eol.org/) and ZooBank (http://www.zoobank.org/), then progressively expanding its content-sharing partners, now including Plazi (
Material and methods
We searched the online archive of Zootaxa publications for open access articles that included taxonomic treatments on spiders (Order: Araneae; http://www.mapress.com/zootaxa/taxa/Araneae.html). By the time the pro-iBiosphere project ended in August 2014, Zootaxa had published 531 articles on spiders, 45 (8.5%) of which were openly accessible. Eight of the open access articles contained no taxonomic treatments (e.g., were errata, editorials, obituaries, phylogenetic studies, etc.). The remaining 37 (7.0%) articles were marked up using the GoldenGATE Document Editor (
Our markup approach structures data that relate to publications, treatments, and specimens. Data on publications include basic bibliographic information and the treatments they contain. Treatments are categorized according to taxonomic rank (species, genus, family, etc.), taxonomic status (new species, new combination, new genus, etc.), and taxonomic hierarchy. Sexually mature specimens are classified by gender (with other attributes available as relevant to taxonomic group, such as the caste for ants), collecting country, other locality-based fields, institutional collection code, type status (holotype, paratype, etc.), collector name, collection date, and elevation.
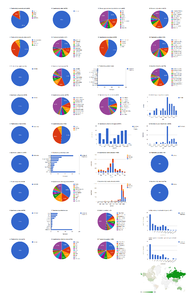
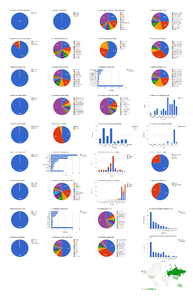
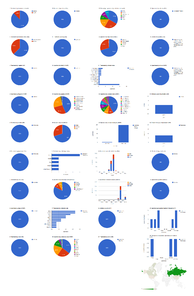
The Plazi srsStatCharts utility (http://plazi.cs.umb.edu/GgServer/srsStatCharts) was used to create a series of interactive dashboard pages to summarize these data. This utility works with the Google Visualization API (https://developers.google.com/chart/). Source code for aggregation of XML structured treatment data on the Plazi server is available at https://code.google.com/p/goldengate-server-docs/source/browse/#git%2Fsrc%2Fde%2Fuka%2Fipd%2Fidaho%2FgoldenGateServer%2Fdcs. The dashboard pages display a series of charts for various categories of data contained within the set of open access articles in Zootaxa and articles in Biodiversity Data Journal containing treatments on spiders. The dashboard pages were: 1) all treatments (Zootaxa), 2) species-rank treatments (Zootaxa), 3) all treatments (BDJ), 4) species-rank treatments (BDJ), 5) all treatments (Zootaxa + BDJ), 6) species-rank treatments (Zootaxa + BDJ) 7) one selected collection (California Academy of Sciences, CAS), 8) one selected collecting country (Russia), 9) one selected collector (Y. M. Marusik), 10) one selected article (
Results
The dashboards are based on the 37 open access articles in Zootaxa containing treatments on spiders (Table
Open access articles in Zootaxa containing treatments on spiders
The 37 open access Zootaxa articles on spiders contain 254 treatments, of which 212 are species treatments, based on 4,779 specimens (species treatments contain citations of 4,773 specimens, the difference in numbers is due to 26 specimens identified to genus only) (Fig.

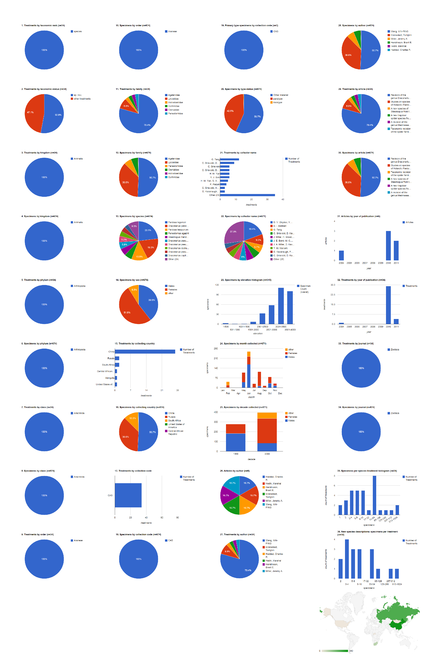
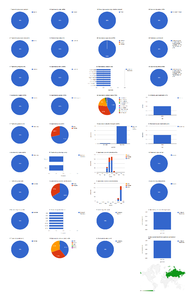
Biodiversity Data Journal articles containing treatments on spiders
The five spider articles published in Biodiversity Data Journal before August 2014 contain 742 treatments, of which 672 are species treatments, based on 3,432 specimens (species treatments contain citations of 3,399 specimens) (Fig.
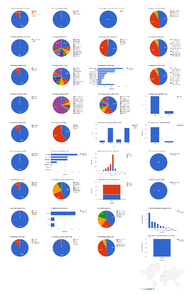
Dashboard charts summarizing content from five articles published in Biodiversity Data Journal containing treatments on spiders (Suppl. materials
b: Species-rank treatments.
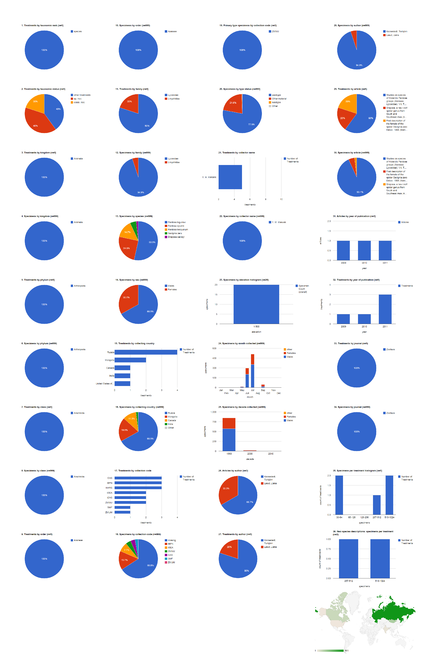
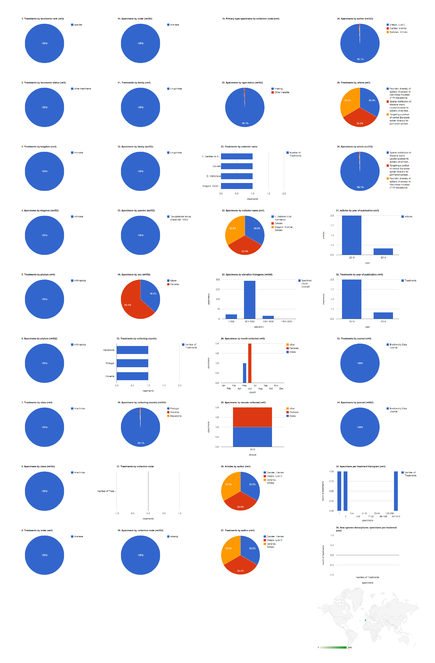
Aggregating data from XML publishing and legacy markup
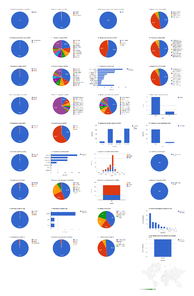
The 41 articles from both journals contain a total of 996 treatments (884 species treatments) based on 8,231 specimens (species treatments contain citations of 8,172 specimens). About 3/4 of the treatments are published in Biodiversity Data Journal, but more than 58% of the specimens are cited among the much larger total number of Zootaxa articles (Fig.
Dashboard charts summarizing content from 37 open access articles published in Zootaxa and five articles published in Biodiversity Data Journal containing treatments on spiders (Suppl. materials
b: Species-rank treatments.
Institutional collection: CAS
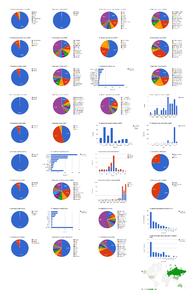
The California Academy of Sciences collection contributed specimens to 34 treatments in six articles, all published in Zootaxa; most of them (29 treatments) in three articles published in 2010 (Fig.
Dashboard charts summarizing content from species-rank treatments published in open access articles in Zootaxa and Biodiversity Data Journal containing treatments on spiders, filtered to show only specimens from the collection of the California Academy of Sciences (Suppl. material
Collecting country: Russia
The 1,660 specimens collected in Russia were cited in six species treatments (five Lycosidae and one Linyphiidae), included three new species, and published in two articles in 2009 and 2011, both in Zootaxa (Fig.
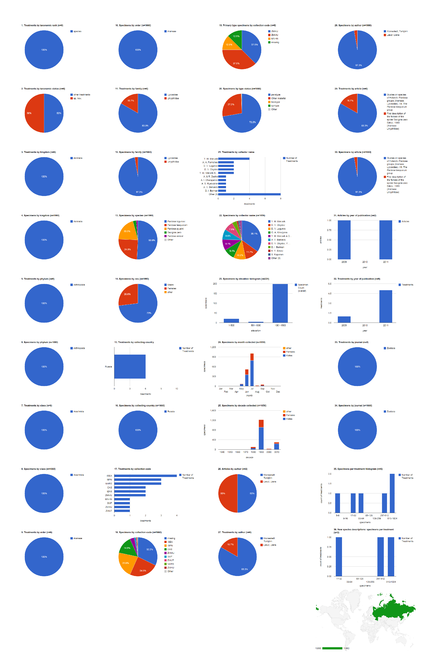
Dashboard charts summarizing content from species-rank treatments published in open access articles in Zootaxa and Biodiversity Data Journal containing treatments on spiders, filtered to show only specimens collected in Russia (Suppl. material
Collector name: Y. M. Marusik
The 869 specimens collected solely by Y. M. Marusik were cited in five treatments (four Lycosidae and one Linyphiidae) including two new species, and were published in three articles, all appearing in Zootaxa (Fig.
Dashboard charts summarizing content from species-rank treatments published in open access articles in Zootaxa and Biodiversity Data Journal containing treatments on spiders, filtered to show only specimens collected by Y. M. Marusik (Suppl. material
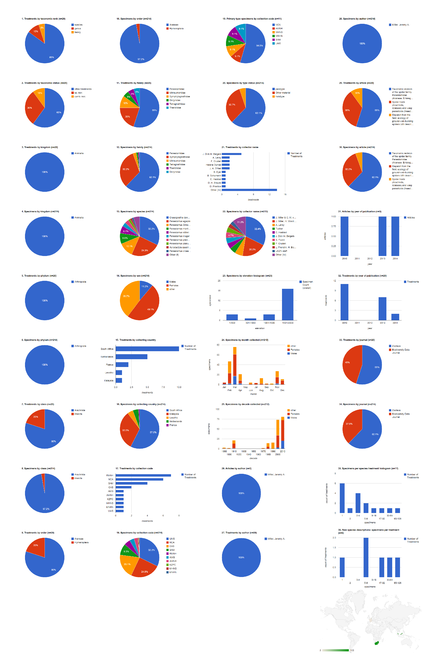
Article: Kronestedt and Marusik 2011
This article is the seventh in a series on Holarctic members of the wolf spider genus Pardosa (Lycosidae). The publication contains seven species treatments and one higher (species group) treatment based on 1,957 specimens in the family Lycosidae; three of the treatments are new species (Fig.
Treatment: Pardosa zyuzini in Kronestedt & Marusik 2011
Pardosa zyuzini is one of seven species treatments and one of three new species in
Species: Tenuiphantes tenuis
Records of this linyphiid spider based on a total of 352 specimens appeared in three articles, all published in Biodiversity Data Journal (Fig.
Dashboard charts summarizing data published in open access articles in Zootaxa and Biodiversity Data Journal containing treatments on spiders, filtered to show only one species: Tenuiphantes tenuis (Suppl. material
Author: Jeremy A. Miller
Jeremy A. Miller was the lead author on two publications in Biodiversity Data Journal and one open access publication in Zootaxa containing treatments on spiders (Fig.
Dashboard charts summarizing data published in open access articles in Zootaxa and Biodiversity Data Journal containing treatments on spiders, filtered to show only one lead author: Jeremy A. Miller (Suppl. material
Discussion
Data interoperability and prospective publishing: recommendations for BDJ authors
Specimen data associated with spiders (among other taxa) are often structured to reflect multiple individual specimens in a single vial. A lot of specimens may include adult males, adult females, and sexually immature specimens for which sex is undetermined; all of these specimens may be associated with a single specimen code. We find that abundance and sex capture useful information about specimen data. For example, the phenology of males and females may be different, so the ability to determine what time of year a particular sex has been collected can be valuable to an investigator planning field work. Darwin Core expects a lot of specimens to all be of the same type (e.g., sex) and does not offer a simple way to represent heterogeneous objects in a single record (see https://github.com/tdwg/dwc/issues/35, https://github.com/tdwg/dwc/issues/36). To work around this, Plazi's SRS can parse the number of male and female specimens entered in the "sex" field (e.g., 1 male, 4 females), and either sum these values to determine the total abundance or use the individualCount field for this purpose (the individualCount can be higher than the sum of males and females when non-adult specimens are present; the difference between individualCount and the sum of males and females is automatically added to the category "other"). We recommend that authors of taxonomic treatments in BDJ complete both the individualCount field and sex field with their materials citations.
Information on the institution where particular specimens were deposited was frequently absent from the structured materials citations data in BDJ articles (Fig.
Biodiversity Data Journal was launched with the motto: "making small data big." Realizing the potential of this vision requires that authors contribute structured specimen data with a sufficient level of granularity and detail. Otherwise, the power of data aggregation is curtailed.
Legacy data: materials citations with ambiguous structure
The extent to which primary specimen data can be extracted from legacy literature depends on how the data are structured. Ideally, the data that refer to 'materials citations' link particular specimens to particular institutions and collecting events. Occasionally, specimen counts, institutions, and collecting events are disassociated. For example, in the treatment on Pardosa zyuzini (
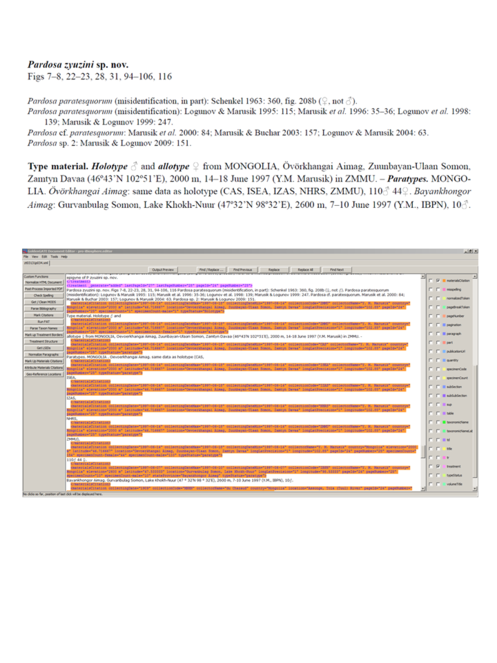
Excerpt from a taxonomic treatment with ambiguously structured materialsCitations data in the source document. The top frame shows the published PDF, the lower frame shows the same content in GoldenGATE with the treatment and materialsCitation tags revealed. The source document is ambiguous about how many paratype specimens are deposited in which natural history collection. This is represented in XML by associating the collection event data (place, time, collector) with each of the listed institutional collections but no quantity of specimens is assigned to any collection. The 110 male and 44 female specimens are also associated with the collection event data, but with no institutional collection.
Legacy data: incomplete integration with GBIF
XML structured documents in Plazi are available for aggregation by GBIF. The treatments from Zootaxa included in this study supply records for 120 species that otherwise have no records in GBIF. However, the records for 98 of these species are not yet visible on GBIF. In most cases, the reason appears to be that the species is not in the GBIF backbone taxonomy (
Tracking people
One limitation of the way specimen data are currently structured is that the "collectorName" field does not parse out individual collectors when more than one person is involved. The problem that this creates is evident in the case of the most prolific collector. Marusik collected specimens alone and in collaboration with others, including D. V. Obydov. Some records listed Marusik as the first collector, others listed Obydov first. These are counted in the “Specimens by collector name” chart as three different collectors (1: Y. M. Marusik, 2: Y. M. Marusik & D. V. Obydov, 3: D. V. Obydov & Y. M. Marusik). In such cases, we may wish to attribute half of the specimens to each collector (or more generally, divide the number of specimens collected by the number of collectors and attribute that fraction to each member of the team). Alternatively, we might want to count the number of specimens that each individual contributed to collecting, which would result in a total count of specimens equal to or greater than the actual number collected. Similarly, we see in the “Treatments by collector name” chart for all data that Charles Griswold appears, alone or with collaborators, in four of the top ten rankings. A search of the underlying data reveals that Griswold, alone or with collaborators, contributed specimens to 22 treatments. As currently structured, it is not easy to track this.
In addition to specimen collector, individuals have two other main roles in taxonomic research: as publication (co-)authors and as taxonomic authorities (in which case the name of one or more individuals is associated with a taxonomic name). Both of these can be conducted as solo or collaborative activities. Summaries of individual contributions to taxonomic research should allow us to derive data on all three functions so that scientists get due credit for their efforts.
Data exchange and research metrics
Data exchange between taxonomic research and institutional collections is less sophisticated currently than it could be. Collections-based institutions have an interest in monitoring how their collections are used in taxonomic research. XML-structured documents make it possible to import data from marked up literature into collections databases, making such databases more current and complete. Institutions can be compared by the number of specimens cited, or the number of treatments contributed to. Such metrics could produce healthy competition among institutions, stimulate specimen circulation in support of taxonomic research, and provide quantitative metrics in support of further funding. Similar metrics could form a basis for nuanced comparison of individual researchers. We might be interested not just in the number of treatments published, but in the number of specimens examined per treatment. We might be interested in the number of specimens and taxa collected by an individual that appear in published taxonomic research. Instead of looking just at individuals, these data could be aggregated by categories such as institution or country.
As more structured data from legacy literature become available and are shared with collections databases, it will become necessary to recognize instances of the same object cited in a database and one or more publications. Taxonomic research typically proceeds through the re-examination of specimens previously studied and cited by other taxonomists, including but not limited to primary type specimens. Without a mechanism to identify these as the same object, the total number of specimens known could become difficult to discern. Likewise, the same specimen recorded in a collections database and cited by a taxonomic paper should be recognized as one object, not two. This highlights the need for globally unique identifiers for specimens, whose application remains problematic in biodiversity informatics (
Research questions and taxonomic literature
Some recent publications have used specimen data from taxonomic literature to investigate aspects of biodiversity knowledge. We adapt our spider dataset to two of these questions: 1) the time lag between species discovery and description, and 2) the prevalence of rare species in species descriptions.
A key difference between these previous efforts and our literature markup project is that the primary data upon which our analyses are based are readily accessible to all from Plazi (http://plazi.cs.umb.edu/GgServer/srsStats) and can be built upon as treatments are added.
Prospective taxonomic publishing: the end of unstructured taxonomic literature
The rate of publication in taxonomy continues to rise, as does the potential for accelerated transition from discovery to publication (
Conclusions
The modest pilot demonstration presented here is focused on spider literature, but the approach can be applied to any taxonomic literature. Our accumulated biodiversity knowledge includes an estimated 2-3 billion specimens in natural history collections and 500 million pages of printed text (
Acknowledgements
This project was supported by pro-iBiosphere and EU BON, two FP-7 (European Union Seventh Framework Programme, 2007-2013) grants (No 312848 and 308454). Jan Legind generously provided the results of a custom query of GBIF data. Daniel Gloor, Christian Kropf and Wolfgang Nentwig helpfully provided an export of pre-release bibliographic data from the new World Spider Catalog. Thanks to Torsten Dikow, Rob Guralnick, Rod Page, Anne Thessen, and Ross Mounce for constructive comments on an earlier draft of this manuscript. Special thanks to Zhi-Qiang Zhang and Magnolia Press for their cooperation expediting assignment of DOIs to back issues of Zootaxa.
References
- Taxonomic information exchange and copyright: the Plazi approach.BMC Research Notes2(1):53. https://doi.org/10.1186/1756-0500-2-53
- Approaches to estimating the universe of natural history collections data.Biodiversity Informatics7(2):81‑92. https://doi.org/10.17161/bi.v7i2.3991
- Promoting Access to Public Research Data for Scientific, Economic, and Social Development.Data Science Journal3:135‑152. https://doi.org/10.2481/dsj.3.135
- Description of two new species of Avicularia Lamarck 1818 and redescription of Avicularia diversipes (C.L. Koch 1842) (Araneae, Theraphosidae, Aviculariinae)—three possibly threatened Brazilian species.Zootaxa2223:25‑47. https://doi.org/10.11646/zootaxa.2223.1.2
- Two new species of Pamphobeteus Pocock 1901 (Araneae: Mygalomorphae: Theraphosidae) from Brazil, with a new type of stridulatory organ.Zootaxa1826:45‑58. https://doi.org/10.11646/zootaxa.1826.1.3
- Revalidation of Pterinopelma Pocock 1901 with description of a new species and the female of Pterinopelma vitiosum (Keyserling 1891) (Araneae: Theraphosidae: Theraphosinae).Zootaxa2814:1‑18. https://doi.org/10.11646/zootaxa.2814.1.1
- A new Garcorops species from Madagascar copal (Araneae: Selenopidae).Zootaxa445:1‑7. https://doi.org/10.11646/zootaxa.445.1.1
- A new Savignia from Cretan caves (Araneae: Linyphiidae).Zootaxa109:1‑8. https://doi.org/10.11646/zootaxa.109.1.1
- High-resolution X-ray computed tomography of an extant new Donuea (Araneae: Liocranidae) species in Madagascan copal.Zootaxa2427:25‑35. https://doi.org/10.11646/zootaxa.2427.1.3
- Targeting a portion of central European spider diversity for permanent preservation.Biodiversity Data Journal1:e980. https://doi.org/10.3897/bdj.1.e980
- Corrigendum: Targeting a portion of central European spider diversity for permanent preservation.Biodiversity Data Journal3:e4301. https://doi.org/10.3897/bdj.3.e4301
- Undersampling bias: the null hypothesis for singleton species in tropical arthropod surveys.Journal of Animal Ecology78(3):573‑584. https://doi.org/10.1111/j.1365-2656.2009.01525.x
- New Linyphiidae spiders associated with playas in the Southern High Plains (Llano Estacado) of Texas (Arachnida: Araneae).Zootaxa1529:49‑60. https://doi.org/10.11646/zootaxa.1529.1.4
- Spatial distribution of Madeira Island Laurisilva endemic spiders (Arachnida: Araneae).Biodiversity Data Journal2:e1051. https://doi.org/10.3897/bdj.2.e1051
- Description of the males of Euprosthenops australis Simon, 1898 and Euprosthenopsis pulchella (Pocock, 1902) (Araneae: Pisauridae).Zootaxa3857(1):137‑150. https://doi.org/10.11646/zootaxa.3857.1.8
- Faunistic diversity of spiders (Araneae) in Galichitsa mountain (FYR Macedonia).Biodiversity Data Journal1:e977. https://doi.org/10.3897/bdj.1.e977
- Dikow T, Meier R, Vaidya G, Londt JH (2009) Biodiversity research based on taxonomic revisions - a tale of unrealized opportunities. In: Pape T, Bickel D, Meier R (Eds) Diptera Diversity: Status, Challenges and Tools.Koninklijke Brill NV
- Improving the GBIF Backbone matching.GBIF Developer Blog. URL: http://gbif.blogspot.de/2015/03/improving-gbif-backbone-matching.html
- Phylogenetic relationships of the comb-footed spider subfamily Spintharinae (Araneae, Araneoidea, Theridiidae), with generic diagnoses and a key to the genera.Zootaxa3666(2):171‑193. https://doi.org/10.11646/zootaxa.3666.2.4
- 21 years of shelf life between discovery and description of new species.Current Biology22(22):R943‑R944. https://doi.org/10.1016/j.cub.2012.10.029
- A new genus and five new species of Astieae (Araneae: Salticidae) from Australia, with remarks on distribution.Zootaxa2526:37‑53. https://doi.org/10.11646/zootaxa.2526.1.2
- A new species and records of Diolenius Thorell, 1870 (Araneae: Salticidae) from New Guinea.Zootaxa3664(1):63‑68. https://doi.org/10.11646/zootaxa.3664.1.4
- Darwin Core Archives – How-to Guide, version 1, released on 1 March 2011 (contributed by Remsen D, Braak, K, Döring M, Robertson, T).Global Biodiversity Information Facility,Copenhagen,21pp. URL: http://www.gbif.org/resource/80636
- The Web and the Structure of Taxonomy.Systematic Biology56(6):943‑955. https://doi.org/10.1080/10635150701777521
- The Trouble with Triplets in Biodiversity Informatics: A Data-Driven Case against Current Identifier Practices.PLoS ONE9(12):e114069. https://doi.org/10.1371/journal.pone.0114069
- Community Next Steps for Making Globally Unique Identifiers Work for Biocollections Data.ZooKeys494:133‑154. https://doi.org/10.3897/zookeys.494.9352
- A revision of the genus Medmassa Simon, 1887 (Araneae: Corinnidae) in the Afrotropical Region.Zootaxa2361:1‑12. https://doi.org/10.11646/zootaxa.2361.1.1
- A decadal view of biodiversity informatics: challenges and priorities.BMC Ecology13(1):16. https://doi.org/10.1186/1472-6785-13-16
- Molecular and morphological characterisation of new species in the trapdoor spider genus Aname (Araneae: Mygalomorphae: Nemesiidae) from the Pilbara bioregion of Western Australia.Zootaxa3383:15‑38. https://doi.org/10.11646/zootaxa.3383.1.3
- A new trapdoor spider species from the southern Coast Ranges of California (Mygalomorphae, Antrodiaetidae, Aliatypus coylei, sp. nov,), including consideration of mitochondrial phylogeographic structuring.Zootaxa2963:55‑68. https://doi.org/10.11646/zootaxa.2963.1.3
- Descriptions of a new species and previously unknown males of Nesticus (Araneae: Nesticidae) from caves in Eastern North America, with comments on species rarity.Zootaxa904:1‑19. https://doi.org/10.11646/zootaxa.904.1.1
- A new species of Stasimopus from the Eastern Cape Province of South Africa (Araneae, Mygalomorphae, Ctenizidae), with notes on its natural history.Zootaxa619:1‑14. https://doi.org/10.11646/zootaxa.619.1.1
- Two sympatric species of Antrodiaetus from southwestern North Carolina (Araneae, Mygalomorphae, Antrodiaetidae).Zootaxa872:1‑19. https://doi.org/10.11646/zootaxa.872.1.1
- Papakula and Hesydrimorpha: how two spider genera were described from the same species collected from the same locality (Araneae: Pisauridae).Zootaxa2551:65‑68. https://doi.org/10.11646/zootaxa.2551.1.3
- New species of the spider genus Olios Walckenaer, 1837 (Araneae: Sparassidae: Sparassinae) from Laos.Zootaxa3228:61‑68. https://doi.org/10.11646/zootaxa.3228.1.3
- Revision of the genus Sinopoda Jäger, 1999 in Laos with discovery of the first eyeless huntsman spider species (Sparassidae: Heteropodinae).Zootaxa3415:37‑57. https://doi.org/10.11646/33
- Clubionidae from Laos and Thailand (Arachnida: Araneae).Zootaxa2730:23‑43. https://doi.org/10.11646/zootaxa.2730.1.2
- Selenops muehlmannorum spec. nov. from Southern Laos (Araneae: Selenopidae).Zootaxa2883:65‑68. https://doi.org/10.11646/zootaxa.2883.1.5
- Draposa, a new wolf spider genus from South and Southeast Asia (Araneae: Lycosidae).Zootaxa2637:31‑54. https://doi.org/10.11646/zootaxa.2637.1.2
- Studies on species of Holarctic Pardosa groups (Araneae, Lycosidae). VII. The Pardosa tesquorum group.Zootaxa3131:1‑34. https://doi.org/10.11646/zootaxa.3131.1.1
- First description of the female of the spider Savignia zero Eskov, 1988 (Araneae: Linyphiidae).Zootaxa2267:65‑68. https://doi.org/10.11646/zootaxa.2267.1.5
- Six new species of the spider family Ochyroceratidae Fage 1912(Arachnida: Araneae) from Southeast Asia.Zootaxa3768(2):119. https://doi.org/10.11646/zootaxa.3768.2.2
- Determining Species Boundaries in a World Full of Rarity: Singletons, Species Delimitation Methods.Systematic Biology61(1):165‑169. https://doi.org/10.1093/sysbio/syr030
- Significance of Specimen Databases from Taxonomic Revisions for Estimating and Mapping the Global Species Diversity of Invertebrates and Repatriating Reliable Specimen Data.Conservation Biology18(2):478‑488. https://doi.org/10.1111/j.1523-1739.2004.00233.x
- Taxonomic revision of the spider family Penestomidae (Araneae, Entelegynae).Zootaxa2534:1‑36. https://doi.org/10.11646/zootaxa.2534.1.1
- Cyberdiversity: Improving the Informatic Value of Diverse Tropical Arthropod Inventories.PLoS ONE9(12):e115750. https://doi.org/10.1371/journal.pone.0115750
- Spider hosts (Arachnida, Araneae) and wasp parasitoids (Insecta, Hymenoptera, Ichneumonidae, Ephialtini) matched using DNA barcodes.Biodiversity Data Journal1:e992. https://doi.org/10.3897/bdj.1.e992
- Corrected data re-harvested: curating literature in the era of networked biodiversity informatics.Biodiversity Data Journal3:e4552. https://doi.org/10.3897/bdj.3.e4552
- From taxonomic literature to cybertaxonomic content.BMC Biology10(1):87. https://doi.org/10.1186/1741-7007-10-87
- Dispatch from the field: ecology of ground-web-building spiders with description of a new species (Araneae, Symphytognathidae).Biodiversity Data Journal2:e1076. https://doi.org/10.3897/bdj.2.e1076
- Rare species in communities of tropical insect herbivores: pondering the mystery of singletons.Oikos89:564‑572. https://doi.org/10.1034/j.1600-0706.2000.890316.x
- Genetic relationships of Amaurobioides (Anyphaenidae) spiders from the southeastern coast of New Zealand.Zootaxa1425:1‑10. https://doi.org/10.11646/zootaxa.1425.1.1
- Redescription of Lystrocteisa Simon, 1884 (Araneae: Salticidae) from New Caledonia.Zootaxa3646(5):587. https://doi.org/10.11646/zootaxa.3646.5.8
- Review of the Nearctic genus Scyletria Bishop & Crosby (Araneae, Linyphiidae), with a transfer of S. jona to Mermessus O. Pickard-Cambridge.Zootaxa1744:31‑40. https://doi.org/10.11646/zootaxa.1744.1.3
- Scientific names of organisms: attribution, rights, and licensing.BMC Research Notes7(1):79. https://doi.org/10.1186/1756-0500-7-79
- [Internet].Journal Article Tag Suite Conference (JATS-Con) Proceedings 2012,Bethesda (MD): National Center for Biotechnology Information (US). URL: http://www.ncbi.nlm.nih.gov/books/NBK100351/
- XML schemas and mark-up practices of taxonomic literature.ZooKeys150:89. https://doi.org/10.3897/zookeys.150.2213
- Semantic tagging of and semantic enhancements to systematics papers: ZooKeys working examples.ZooKeys50:1‑16. https://doi.org/10.3897/zookeys.50.538
- Time to model all life on Earth.Nature493:295‑297. URL: http://www.nature.com/nature/journal/v493/n7432/full/493295a.html
- A new tarantula species from northern Australia (Araneae, Theraphosidae).Zootaxa1004:15‑28. https://doi.org/10.11646/zootaxa.1004.1.2
- Revisions of Australian ground-hunting spiders. V. A new lycosoid genus from eastern Australia (Araneae: Tengellidae).Zootaxa3305:28‑52. https://doi.org/10.11646/zootaxa.3305.1.2
- GoldenGATE Document Editor.Version 3.Plazi. URL: http://www.plazi.org/wiki/GoldenGATE_Editor
- On the Australian linyphiid spider Alaxchelicera ordinaria Butler, 1932 (Araneae).Zootaxa3750(2):193‑193. https://doi.org/10.11646/zootaxa.3750.2.8
- Synonymy of Homalopoltys (Araneae: Araneidae) with the genus Dolichognatha (Araneae: Tetragnathidae) and descriptions of two new species.Zootaxa1775:1‑24. https://doi.org/10.11646/zootaxa.1775.1.1
- Redescription and generic placement of the spider Cryptachaea gigantipes (Keyserling, 1890) (Araneae: Theridiidae) and notes on related synanthropic species in Australasia.Zootaxa3507:38‑56. https://doi.org/10.11646/zootaxa.3507.1.2
- Beyond dead trees: integrating the scientific process in the Biodiversity Data Journal.Biodiversity Data Journal1:e995. https://doi.org/10.3897/bdj.1.e995
- Data issues in the life sciences.ZooKeys150:15. https://doi.org/10.3897/zookeys.150.1766
- Reuniting males and females: redescriptions of Nuisiana arboris (Marples 1959) and Cambridgea reinga Forster & Wilton 1973 (Araneae: Desidae, Stiphidiidae).Zootaxa2739:41‑50. https://doi.org/10.11646/zootaxa.2739.1.4
- Enriched biodiversity data as a resource and service.Biodiversity Data Journal2:e1125. https://doi.org/10.3897/bdj.2.e1125
- Revision of the genus Draconarius Ovtchinnikov 1999 (Agelenidae: Coelotinae) in Yunnan, China, with an analysis of the Coelotinae diversity in the Gaoligongshan Mountains.Zootaxa2593:1‑127. https://doi.org/10.11646/zootaxa.2593.1.1
- World Spider Catalog.Version 16.Natural History Museum Bern. URL: http://wsc.nmbe.ch
Supplementary materials
All records in GBIF with taxonomic ranks (kingdom, phylum, class, order, and species), basis of record (e.g., preserved specimen), and count of records, exported from GBIF on 7 December 2014.
Ranked list of journal/publisher exported from the World Spider Catalog 14 October 2014 with total articles by source, cumulative articles, and cucmulative proportion of articles.
List of journal/publisher by ranked by treatment count exported from the World Spider Catalog 14 October 2014 with total treatments by source, cumulative treatments, and cumulative proportion of treatments.
Dashboard charts summarizing content from 37 open access articles published in Zootaxa containing treatments on spiders. This page shows data from all treatments. When viewed using a browser (such as Google Chrome) with an internet connection, this page sends a series of queries to Plazi and integrates the results with the Google Charts API to produce 37 dashboard charts.
Dashboard charts summarizing content from 37 open access articles published in Zootaxa containing treatments on spiders. This page shows data from species-rank treatments. When viewed using a browser (such as Google Chrome) with an internet connection, this page sends a series of queries to Plazi and integrates the results with the Google Charts API to produce 37 dashboard charts.
Dashboard charts summarizing content from 5 articles published in Biodiversity Data Journal containing treatments on spiders. This page shows data from all treatments. When viewed using a browser (such as Google Chrome) with an internet connection, this page sends a series of queries to Plazi and integrates the results with the Google Charts API to produce 37 dashboard charts.
Dashboard charts summarizing content from 5 articles published in Biodiversity Data Journal containing treatments on spiders. This page shows data from species-rank treatments. When viewed using a browser (such as Google Chrome) with an internet connection, this page sends a series of queries to Plazi and integrates the results with the Google Charts API to produce 37 dashboard charts.
Dashboard charts summarizing content from 42 articles published either as open access articles published in Zootaxa or in Biodiversity Data Journal, containing treatments on spiders. This page shows data from all treatments. When viewed using a browser (such as Google Chrome) with an internet connection, this page sends a series of queries to Plazi and integrates the results with the Google Charts API to produce 37 interactive dashboard charts.
Dashboard charts summarizing content from 42 articles published either as open access articles published in Zootaxa or in Biodiversity Data Journal, containing treatments on spiders. This page shows data from species-rank treatments. When viewed using a browser (such as Google Chrome) with an internet connection, this page sends a series of queries to Plazi and integrates the results with the Google Charts API to produce 37 interactive dashboard charts.
Dashboard charts showing only specimens from the collection of the California Academy of Sciences. This page shows data from species-rank treatments. When viewed using a browser (such as Google Chrome) with an internet connection, this page sends a series of queries to Plazi and integrates the results with the Google Charts API to produce 37 interactive dashboard charts.
Dashboard charts showing only specimens collected in Russia. This page shows data from species-rank treatments. When viewed using a browser (such as Google Chrome) with an internet connection, this page sends a series of queries to Plazi and integrates the results with the Google Charts API to produce 37 interactive dashboard charts.
Dashboard charts showing only specimens collected by Y. M. Marusik. This page shows data from species-rank treatments. When viewed using a browser (such as Google Chrome) with an internet connection, this page sends a series of queries to Plazi and integrates the results with the Google Charts API to produce 37 interactive dashboard charts.
Dashboard charts showing content from one article, Kronestedt and Marusik 2011. This page shows data from all treatments. When viewed using a browser (such as Google Chrome) with an internet connection, this page sends a series of queries to Plazi and integrates the results with the Google Charts API to produce 37 interactive dashboard charts.
Dashboard charts showing content from one treatment: Pardosa zyuzini in Kronestedt and Marusik (2011). When viewed using a browser (such as Google Chrome) with an internet connection, this page sends a series of queries to Plazi and integrates the results with the Google Charts API to produce 37 interactive dashboard charts.
Dashboard charts showing only specimens of the linyphiid spider Tenuiphantes tenuis. When viewed using a browser (such as Google Chrome) with an internet connection, this page sends a series of queries to Plazi and integrates the results with the Google Charts API to produce 37 interactive dashboard charts.
Dashboard charts showing content from articles by Jeremy A. Miller (lead author). When viewed using a browser (such as Google Chrome) with an internet connection, this page sends a series of queries to Plazi and integrates the results with the Google Charts API to produce 37 interactive dashboard charts.
A brief explanation of how to create and customize interactive charts using data on Plazi.