|
Biodiversity Data Journal :
Data Paper (Biosciences)
|
|
Corresponding author:
Academic editor: Samuel James
Received: 08 Sep 2015 | Accepted: 09 Nov 2015 | Published: 13 Nov 2015
© 2015 Jean-Pierre Rossi, Patrick Lavelle
This is an open access article distributed under the terms of the Creative Commons Attribution License (CC BY 4.0), which permits unrestricted use, distribution, and reproduction in any medium, provided the original author and source are credited.
Citation:
Rossi J, Lavelle P (2015) The spatiotemporal pattern of earthworm community in the grass savannas of Lamto (Ivory Coast). Biodiversity Data Journal 3: e6515. https://doi.org/10.3897/BDJ.3.e6515
|
|
Abstract
Background
The impact of earthworms on both soil physical properties and soil organic matter dynamics has been well documented (
New information
We provide the results of a 5 dates survey of earthworm community in a grass savanna of Lamto (Ivory Coast) conducted between 1995 and 1997. At each sampling date, earthworm community was assessed by hand-sorting a set of 100 soil monoliths distributed on a regular grid of 5 m mesh. These data were analyzed in
Keywords
Earthworm community, space-time data, multivariate analysis, grass savanna, Eudrilidae, Millsonia anomala, Dichogaster agilis, west Africa
Introduction
Earthworms play an important role is soil functioning because they affect soil physical structure, soil matter dynamics and interact with other soil dwellers (
It is beyond the scope of the present paper to discuss the statistical approaches that allow to perform such data processing. Various tools are available and the Partial Triadic Analysis (PTA) has proved to be effective on several occasions (
Because space-time analyses are still not familiar to many biologists, we believe that an educational effort is welcome. One reason why the dissemination of such methods is still limited while computer resources are available (
Sampling methods
The data were collected a grass savanna (Loudetia simplex) in the Station d’Ecologie Tropicale de Lamto (Ivory Coast) (5°02’W, 6°13’N) at a place known as “le virage glissant”. The mean annual rainfall is ca 1200 mm and the mean temperature 28 °C. A dry season occurs from December to February and a rainy season from March to November interrupted by a decrease in rainfall during August. We sampled earthworm community within a plot of 45 × 45 m which was randomly located within a large area covered with L. simplex and sparse palm trees (Borassus aethiopium) (Fig.
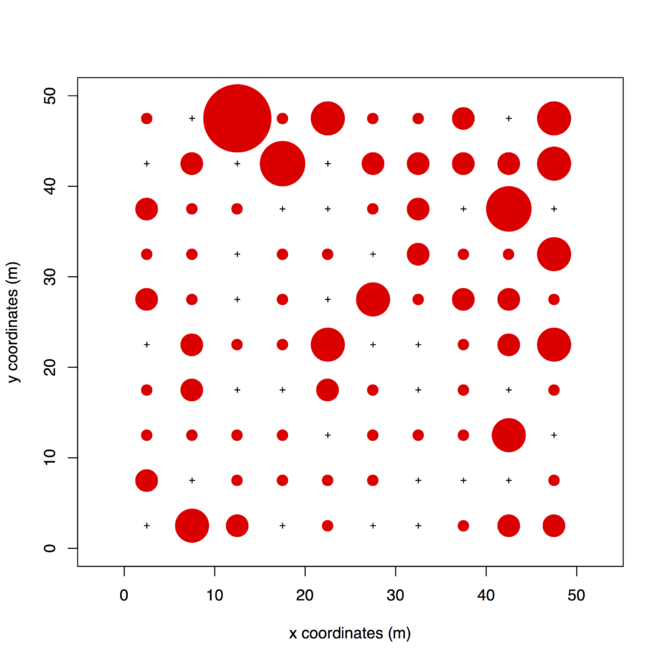
Spatial distribution of the endogeic earthworm Millsonia anomala in the upper 10 cm of soil a grass savanna. Sampling was carried out in May 1995 in Lamto (Ivory Coast). The data are available given in Suppl. material
Earthworms were sampled by hand-sorting a 25 × 25 × 10 cm soil monolith. Hand-sorting was carried out in the field where specimens were identified, counted and released in the soil. Samples were taken in a 10 × 10 grid with a mesh size of 5 m. Since earthworm sampling was carried out on 5 dates, samples were displaced, from one date to another, along a spiral whose origin was represented by the point sampled at the first date. In so doing we avoided taking two soil monoliths exactly at the same location (
Geographic coverage
The grass savanna in the Station d’Ecologie Tropicale de Lamto (Ivory Coast) (5°02’W, 6°13’N).
Taxonomic coverage
The earthworm community of the grass savannas in Lamto comprises several species (
Temporal coverage
sampling was carried out on 5 occasions: May and November 1995, June and December 1996 and June 1997.
Usage rights
Data resources
| Column label | Column description |
|---|---|
| sampling point | sampling point number |
| x coordinates (m) | the x coordinates of sampling locations |
| y coordinates (m) | the y coordinates of sampling locations |
| Eudrilidae | counts: individuals per sampling unit for the Eudrilidae |
| Millsonia anomala (adults) | counts: individuals per sampling unit for Millsonia anomala (adults) |
| Millsonia anomala (subadults) | counts: individuals per sampling unit for Millsonia anomala (subadults) |
| Millsonia anomala (juveniles) | counts: individuals per sampling unit for Millsonia anomala (juveniles) |
| Millsonia anomala (cocoons) | counts: individuals per sampling unit for Millsonia anomala (cocoons) |
| Dichogaster agilis (adults) | counts: individuals per sampling unit for Dichogaster agilis (adults) |
| Dichogaster agilis (subadults) | counts: individuals per sampling unit for Dichogaster agilis (subadults) |
| Dichogaster agilis (juveniles) | counts: individuals per sampling unit for Dichogaster agilis (juveniles) |
| Agastrodrilus sp. | counts: individuals per sampling unit for Agastrodrilus sp. |
| other | counts: individuals per sampling unit for other earthworms |
| Eudrilidae | abundance: individuals per m2 for the Eudrilidae |
| Millsonia anomala (adults) | abundance: individuals per m2 for Millsonia anomala (adults) |
| Millsonia anomala (subadults) | abundance: individuals per m2 for Millsonia anomala (subadults) |
| Millsonia anomala (juveniles) | abundance: individuals per m2 for Millsonia anomala (juveniles) |
| Millsonia anomala (cocoons) | abundance: individuals per m2 for Millsonia anomala (cocoons) |
| Dichogaster agilis (adults) | abundance: individuals per m2 for Dichogaster agilis (adults) |
| Dichogaster agilis (subadults) | abundance: individuals per m2 for Dichogaster agilis (subadults) |
| Dichogaster agilis (juveniles) | abundance: individuals per m2 for Dichogaster agilis (juveniles) |
| Agastrodrilus sp. | abundance: individuals per m2 for Agastrodrilus sp. |
| other | abundance: individuals per m2 for other earthworms |
Acknowledgements
We thank Dr R. Vuattoux, Director of the Station d’Ecologie de Lamto at the time of the work was carried out, for his assistance and interest. We are indebted to R. Zouzou Bi Danko for technical assistance in the field.
Author contributions
JPR and PL designed and performed the experiments and wrote the present note.
References
- The ade4 package-I: One-table methods.R News4:5‑10.
- Stability of the spatio-temporal distribution and niche overlap in neotropical earthworm assemblages.Acta Oecologica30:299‑311. https://doi.org/10.1016/j.actao.2006.06.008
- Dissecting the multi-scale spatial relationship of earthworm assemblages with soil environmental variability.BMC Ecology14:26. https://doi.org/10.1186/s12898-014-0026-4
- Lavelle P (1978) Les Vers de Terre de la savane de Lamto (Côte d’Ivoire): peuplements, populations et fonctions dans l’écosystème.Thesis of the Paris VI University. Publication du Laboratoire de Zoologie de l’ENS n°12,Paris,301pp.
- Soil Ecology.Springer,654pp. https://doi.org/10.1007/978-94-017-5279-4
- The spatiotemporal pattern of a tropical earthworm species assemblage and its relationship with soil structure.Pedobiologia47:497‑503. https://doi.org/10.1078/0031-4056-00219
- Clusters in earthworm spatial distribution.Pedobiologia47:490‑496. https://doi.org/10.1078/0031-4056-00218
- Dissecting the Space-Time Structure of Tree-Ring Datasets Using the Partial Triadic Analysis.PLoS ONE9:e108332. https://doi.org/10.1371/journal.pone.0108332
Supplementary material
The data set provides both count data and the corresponding abundances (individuals per m2) for the earthworms sampled in the upper soil (10 cm depth) in a grass savana (Lamto, Côte d'Ivoire). Sampling was carried out on 100 sampling points located on a square grid with spacing of 5 m. The grid was sampled on 5 occasions: May and November 1995, June and December 1996 and June 1997. Sampling coordinates are given in meters.