|
Biodiversity Data Journal :
Data Paper (Biosciences)
|
|
Corresponding author:
Academic editor: Dimitrios Koureas
Received: 25 Nov 2015 | Accepted: 21 Dec 2015 | Published: 29 Dec 2015
© 2015 Quentin Groom, John Durkin, John O'Reilly, Andy Mclay, A Richards, Janet Angel, Angela Horsley, Megs Rogers, Gordon Young
This is an open access article distributed under the terms of the Creative Commons Attribution License (CC BY 4.0), which permits unrestricted use, distribution, and reproduction in any medium, provided the original author and source are credited.
Citation:
Groom Q, Durkin J, O'Reilly J, Mclay A, Richards A, Angel J, Horsley A, Rogers M, Young G (2015) A benchmark survey of the common plants of South Northumberland and Durham, United Kingdom. Biodiversity Data Journal 3: e7318. https://doi.org/10.3897/BDJ.3.e7318
|
|
Abstract
Background
It is obvious to anyone studying plants in the landscape that man-made environmental change is having profound effects on the abundance, distribution and composition of plant communities. Nevertheless, quantifying these changes and estimating the impact of the different drivers of change is extremely difficult. Botanical surveying can potentially provide insights to the changes that are occurring and inform decisions related to conservation, agriculture and forestry policy. However, much of botanical surveying is conducted in such a way that it is not comparable between dates and places. Any comparison of historical and modern data has to account for biases in the recording of different taxonomic groups, geographic biases and varying surveying effort in time. In 2010 botanical recorders in the Vice Counties of Durham and South Northumberland in the United Kingdom decided to conduct a four year survey specifically to benchmark the abundance and distribution of common plants in their counties. It is intended that this survey will provide a relatively unbiased assessment with which to compare future and past surveys of the area and a means to study the drivers of biodiversity change in the North-east of England.
New information
This survey of Durham and South Northumberland has been designed with two goals, firstly to provide information on common vascular plant species and secondly to provide a dataset that will be versatile with respect to the sorts of questions that can be answered with the data. The survey is primarily an occupancy study of 1km2 grid squares, however, observers were also asked to provide a relative abundance estimate of the species in each grid square. The collection of relative abundance estimate data was an experiment to assess the repeatablity and useablity of such estimates.
Keywords
randomised survey, vascular plants
Introduction
There is a need for active monitoring of organisms and habitats in the wild, not just for curiosity, but to inform us of the changes that are occurring. Environmental change is often reported anecdotally and causation is assumed, but without at least semi-quantitative measurements we cannot hope to unravel the complex interacting factors that are really driving changes. Data are needed to inform decision makers on all aspects of management that affect the countryside, including conservation, land management and farming.
The North-east of England is fairly typical of the landscapes found in the rest of the United Kingdom. It has large urban areas, a long coastline, large expanses of arable land, extensive grazing land, forestry and upland moorland. For biological recording purposes Great Britain and Ireland are divided into Vice Counties, which have permanent borders. The Botanical Society of Britain and Ireland appoints voluntary Vice County Recorders (VCR) to each Vice County and this survey is the result of a collaboration between the VCRs of Durham (JD) and South Northumberland (AJR, QG). The region has a number of active amateur biological recorders and this survey was also seen as a means to give direction to their recording effort.
There are many factors driving biodiversity change in the North-east England, most are common to other areas of Northern Europe, whereas others are more local. Below are listed some of these drivers that could be explored further using these data.
Eutrophication from agricultural fertilizers, waste and atmospheric deposition has become an insidious and pervasive driver of habitat change (
A particular land use change to the North-eastern England has been the conversion of peat moorland into conifer plantations. A notable example in South Northumberland is Kielder Forest, the largest man-made forest in England, it covers 60,000 hectares in the west of the county along the Scottish and Cumbrian border (
Artificial drainage has also been the cause of significant habitat change. A notable historic example was the drainage of Prestwick Carr in the 19th century that led to the local extinction of many species (
Farming practises directly and indirectly change habitats and the landscape. The mechanization of farming occurred some time ago, as did the introduction of modern herbicides and pesticides; however, agriculture continues to change with the introduction of new crops, the changing profitability of livestock versus arable farming and new policies intended to promote good stewardship of the countryside (
Urbanisation, industrialisation and associated development have profoundly changed the environment locally within the region, especially in the eastern lowlands. Smaller-scale developments are ongoing, but mostly confined to areas that have already been developed. Mining of various minerals was a particularly important economic activity in this region and few parts of the region were unaffected by it. Following the relatively recent decline of the coal industry, many former coal mine sites were landscaped and ‘tidied up’. In more recent times mining and quarrying activities have been more localised. Opportunities for wild plants to colonise and survive have been dramatically altered by all of these activities.
Alien species may also have an impact on native communities, though it is difficult to separate their influence from other habitat change. Alien plants exert competitive pressure, but there are also emerging diseases and introduced animals that may exert a pathogenic or herbivorous pressure. The distribution ranges of insects have been moving north in recent years, presumably as a consequence of climate change (
Observations of wild plants in the counties have been made at a number of different spatial resolutions, 1km2, 4km2, 25km2 and 100km2. However, the trend in recent years has been towards finer resolutions. This has been driven by the availability of digital systems for storing observations and by access to systems for mapping and analysing the data. The current survey used a grid of 1km2 and although even finer resolutions would give greater sensitivity to change, 1km2 grid squares are advantageous from many perspectives. This resolution is close to the scale of many landscape features in the English countryside, fields, towns, lakes and hills. They allow surveyors to cover a large area in a reasonable amount of time. This grid square is also clearly indicated on Ordnance Survey maps and on Global Positioning Systems.
From a policy perspective much emphasis is placed on the conservation of rare species even though common plants are those that are most important for ecosystem health and function. The focus of this survey is on those common species and their habitats.
From a statistical perspective there are a large number of options for distributing survey sites. For example, stratification can be used to ensure even representation of different habitat types. Sites can also be distributed non-randomly to evenly cover the environmental space of an area and reduce the impact of spatial autocorrelation. Nevertheless, a completely random approach was chosen to make the results as versatile as possible for whichever questions may in the future be resolved using these data. Some types of analyses may have reduced statistical power when used with a completely random design, but a random survey avoids having to make assumptions about the drivers of changes that may occur in the future and their location.
This approach is not strongly hypothesis driven. However, this is not necessarily a disadvantage. To some extent hypothesis driven monitoring is likely to produce more robust results than undirected monitoring. However, it can also be argued that general monitoring has the advantage of detecting unexpected changes that targeted monitoring would miss (
Former botanical surveys of the North-East of England
The first observations of plants in North-East England come from William Turner [ca. 1508 – 1568] (
Since 2007 all available computerised botanical records for the region have been displayed publically on distribution maps through the Flora of North-East England website (
Project description
The North-East Common Plants Survey
All personnel on this survey were volunteers and had a range of experience in plant identification and botanical surveying. Some were either professional or retired biologists and ecologists, while others are amateurs, though their experience ranged from expert to beginner. The vast majority of observations were made by the more experienced contributors. More than 70 people contributed to the data collected for the project, but the majority of surveys were conducted by the authors, either as individuals or as groups. Conduct and safety advice was provided to the volunteers with links to the standard advice given by the BSBI (
The Watsonian Vice Couties of Durham and South Northumberland cover an area of 6134 km2. Durham’s highest point is Mickle Fell (788m) and South Northumberland’s is Kilhope Law (673m). These counties contain a wide variety of natural and man-made habitats, though those most relevant to this survey are the most extensive. These are upland moors, grazing pasture, arable farming, plantation forestry and urban areas. Other scattered, but common habitats are deciduous woodland, sphagnum bog and freshwater. The area also includes large parts of the North Pennines Area of Outstanding Natural Beauty and Northumberland National Park.
Surveys were conducted using the one kilometre grid squares of the Ordnance Survey (Datum: OSGB36; EPSG:27700). Two hundred 1km2 squares were chosen randomly from all squares in the two Vice Counties, except for squares that fell within the Otterburn Army Training Estate in the north-west of South Northumberland. Random numbers were generated using Microsoft Excel. Only squares with at least 50% of their land within either Durham or South Northumberland were included, though all randomly chosen grid squares with a proportion of open water were included in the survey. Only one square had more than 50% of its area covered by sea. Seven of the randomly selected squares had no public access and were substituted. To avoid spatial bias the substitute squares were randomly selected from one of the four adjoining squares.
Public access to the countryside in the area is quite extensive. Not only were there public footpaths, permissive footpaths, bridleways and common land, but in the west of the counties there are extensive areas of Open Access Land which can be walked freely. In some cases permission was obtained to visit particular sites, specifically some of the lakes that were contained within the survey area. None of the selected squares had areas that were physically impossible to visit, though some in the west are several kilometres from the nearest paved road.
A website created for the survey indicated to volunteers where surveys had already been conducted and was updated regularly. Squares were shown on a map to indicate whether the grid square had already been surveyed in spring, summer, surveyed twice or surveyed three or more times. When requested, suggestions were made to surveyors to guide them where to go. However, there was no attempt to allocate areas to particular surveyors or insist that surveyors should visit particular squares. It was suggested to surveyors that conducting two surveys in different seasons per grid square would be ideal. In the final year the first author made a particular effort to complete squares that had not been covered in the previous surveys.
This survey has been conducted without external funding.
Sampling methods
The surveyors were asked to visit the full range of habitats within the grid square and to look over the whole area. After completing the survey they were asked to assign a DAFOR score (Dominant, Abundant, Frequent, Occasional, Rare) to the relative abundance of the species within the grid square. As there were many ways that the surveyors could interpret the DAFOR scores, written guidelines were also provided (Suppl. materials
The vascular plant biodiversity and landscape complexity varied considerably between sample squares. For this reason there was no attempt to balance the recording time between squares. Heterogeneous areas with a mosaic of habitats in the lowlands required more effort than comparatively uniform areas in the hills. It was left to the individual surveyors to determine when they had completed their survey. However, in the final year additional surveys were conducted in some grid squares deemed to be insufficiently surveyed.
The numbers of surveys conducted for each grid square are summarised in Table
A summary of the surveyed grid squares and the numbers of visits to them. The numbers of surveys are separated by whether each species was assigned a DAFOR abundance estimate. Each square was assessed as to whether it had been well surveyed. This assessment is based on the number and timing of surveys and on the diversity of habitats within the grid square. It is a rough guide to users of these data as to the intensity of surveying at each site.
| Grid Reference | Site Name | Vice County | well surveyed | with DAFOR scores | without DAFOR scores |
| NT6401 | Green Needle Burn | South Northumberland | yes | 1 | 0 |
| NT6602 | Carry Burn | South Northumberland | yes | 1 | 0 |
| NT6905 | Black Cleugh | South Northumberland | yes | 1 | 0 |
| NT7001 | Girdle Fell | South Northumberland | yes | 1 | 0 |
| NT7205 | Lumsdon Law | South Northumberland | yes | 2 | 0 |
| NT7406 | Catcleugh Hill | South Northumberland | yes | 1 | 0 |
| NT9303 | Harbottle Wood | South Northumberland | yes | 2 | 1 |
| NT9502 | Holystone | South Northumberland | yes | 1 | 1 |
| NU2202 | Calvil Head | South Northumberland | yes | 1 | 0 |
| NU2403 | North Togston | South Northumberland | yes | 2 | 0 |
| NY5790 | Bloody Bush | South Northumberland | yes | 1 | 0 |
| NY5882 | Black Knowe | South Northumberland | yes | 1 | 0 |
| NY5982 | Dinmont Lairs | South Northumberland | yes | 1 | 0 |
| NY6097 | Deadwater Rigg | South Northumberland | yes | 1 | 1 |
| NY6281 | Between Slighty Crags and Black Knowe | South Northumberland | yes | 2 | 0 |
| NY6293 | Kielder village | South Northumberland | yes | 2 | 0 |
| NY6368 | Wardrew Wood | South Northumberland | yes | 1 | 2 |
| NY6381 | West of Black Knowe | South Northumberland | yes | 2 | 0 |
| NY6479 | Reamy Rigg | South Northumberland | yes | 2 | 0 |
| NY6483 | Humble Burn | South Northumberland | yes | 2 | 0 |
| NY6581 | East of Black Knowe | South Northumberland | yes | 1 | 0 |
| NY6588 | north-east of Leaplish | South Northumberland | yes | 1 | 2 |
| NY6670 | Peat Rigg | South Northumberland | yes | 1 | 0 |
| NY6678 | Hurtle Winter | South Northumberland | yes | 2 | 0 |
| NY6849 | Dearquarry Sike | South Northumberland | yes | 2 | 1 |
| NY6859 | Coanwood | South Northumberland | yes | 3 | 0 |
| NY6862 | Wydon Eals | South Northumberland | yes | 3 | 1 |
| NY6951 | Slaggyford, near. | South Northumberland | yes | 1 | 0 |
| NY6969 | West of Whiteside | South Northumberland | yes | 1 | 0 |
| NY6977 | Little Gowany Knowe | South Northumberland | yes | 2 | 0 |
| NY7069 | Whiteside | South Northumberland | yes | 2 | 0 |
| NY7070 | Burndivot Common | South Northumberland | yes | 1 | 0 |
| NY7084 | Dings Rigg | South Northumberland | yes | 2 | 0 |
| NY7097 | Smallhope Sikes | South Northumberland | yes | 2 | 0 |
| NY7169 | Brown Rigg | South Northumberland | yes | 1 | 0 |
| NY7191 | Hawkhope Burn | South Northumberland | yes | 2 | 0 |
| NY7290 | The Cross | South Northumberland | yes | 2 | 0 |
| NY7350 | Ayle Burn | South Northumberland | yes | 2 | 0 |
| NY7364 | High Town | South Northumberland | yes | 2 | 0 |
| NY7371 | Hopealone | South Northumberland | yes | 2 | 1 |
| NY7373 | Jock's Close Hill | South Northumberland | yes | 2 | 1 |
| NY7455 | Blaeberry Cleugh | South Northumberland | yes | 1 | 0 |
| NY7548 | Carrier's Hill | South Northumberland | yes | 2 | 0 |
| NY7571 | Drove Rigg | South Northumberland | yes | 1 | 0 |
| NY7685 | The Eals | South Northumberland | yes | 2 | 0 |
| NY7692 | Coals Cleugh | South Northumberland | yes | 1 | 0 |
| NY7760 | Kingswood Burn | South Northumberland | yes | 3 | 0 |
| NY7776 | White Hill | South Northumberland | yes | 2 | 0 |
| NY7787 | Thorneyburn Common | South Northumberland | yes | 3 | 0 |
| NY7853 | Ninebanks | South Northumberland | yes | 1 | 1 |
| NY7866 | Thorngrafton | South Northumberland | yes | 3 | 2 |
| NY7889 | Heathery Hall | South Northumberland | yes | 3 | 0 |
| NY7892 | Ridley Shiel | South Northumberland | yes | 2 | 0 |
| NY7941 | Nag's Head | Durham | no | 0 | 0 |
| NY7982 | Mesling Crags | South Northumberland | yes | 1 | 0 |
| NY8041 | Wellhope Moor | Durham | no | 0 | 0 |
| NY8054 | Round Hill | South Northumberland | yes | 1 | 1 |
| NY8071 | Folly Lake | South Northumberland | yes | 1 | 1 |
| NY8090 | Burdonside | South Northumberland | yes | 1 | 1 |
| NY8235 | Grasshill Common | Durham | no | 0 | 0 |
| NY8244 | Middlehope Moor | Durham & South Northumberland | yes | 1 | 2 |
| NY8285 | Sheel Law | South Northumberland | yes | 1 | 0 |
| NY8395 | Kellyburn Hill | South Northumberland | yes | 1 | 0 |
| NY8444 | Westend Moor | South Northumberland | yes | 1 | 0 |
| NY8451 | Sinderhope | South Northumberland | yes | 2 | 2 |
| NY8536 | Noon Hill | Durham | no | 0 | 0 |
| NY8730 | Wool Pits Hill | Durham | no | 0 | 0 |
| NY8848 | Halleywell Fell | South Northumberland | yes | 1 | 0 |
| NY8850 | Nevin Sike | South Northumberland | yes | 1 | 0 |
| NY8885 | Cragg Farm | South Northumberland | yes | 1 | 0 |
| NY8963 | Low Gate (west of) | South Northumberland | yes | 1 | 1 |
| NY8975 | Short Moor | South Northumberland | yes | 2 | 0 |
| NY8991 | Silvernut Well | South Northumberland | yes | 2 | 0 |
| NY8994 | Fawdon Hill | South Northumberland | yes | 1 | 0 |
| NY9161 | West Dipton Burn | South Northumberland | yes | 3 | 2 |
| NY9165 | West Boat to A69 bridge | South Northumberland | yes | 2 | 2 |
| NY9433 | Out Berry Plain | Durham | no | 0 | 0 |
| NY9465 | West Oakwood area | South Northumberland | yes | 1 | 1 |
| NY9577 | Carrier's Lane | South Northumberland | yes | 2 | 0 |
| NY9646 | Far Sandy Ford | Durham | yes | 1 | 0 |
| NY9659 | Woolley Hospital | South Northumberland | yes | 2 | 1 |
| NY9689 | Todcrag Moss | South Northumberland | yes | 1 | 1 |
| NY9697 | Darden Burn | South Northumberland | yes | 1 | 0 |
| NY9699 | Harehaugh Hill | South Northumberland | yes | 2 | 0 |
| NY9754 | Winnows Hill | South Northumberland | yes | 2 | 1 |
| NY9875 | Hallington | South Northumberland | yes | 1 | 2 |
| NY9889 | East of Birky Burn | South Northumberland | yes | 1 | 0 |
| NY9937 | Thimbleby Hill | Durham | yes | 1 | 1 |
| NY9939 | Stanhope | Durham | yes | 0 | 3 |
| NZ0039 | Jollybody Farm | Durham | yes | 3 | 1 |
| NZ0048 | Harehope Lead Mines | Durham | yes | 2 | 1 |
| NZ0050 | Edmondbyers Common | Durham | yes | 1 | 0 |
| NZ0143 | Waskerley Park | Durham | no | 0 | 0 |
| NZ0162 | Styford Hall | South Northumberland | yes | 2 | 2 |
| NZ0181 | Kidlaw | South Northumberland | yes | 2 | 0 |
| NZ0189 | Harwood Gate | South Northumberland | yes | 2 | 0 |
| NZ0192 | West of Greenleighton | South Northumberland | yes | 2 | 0 |
| NZ0247 | Cross Rig | Durham | no | 0 | 0 |
| NZ0318 | Tees Bank | Durham | yes | 1 | 1 |
| NZ0369 | North of Wall Houses | South Northumberland | yes | 2 | 0 |
| NZ0377 | The Tofts | South Northumberland | yes | 1 | 0 |
| NZ0481 | West Shaftoe | South Northumberland | yes | 1 | 0 |
| NZ0492 | Ewesley Fell | South Northumberland | yes | 1 | 0 |
| NZ0497 | Spylaw | South Northumberland | yes | 2 | 0 |
| NZ0582 | Shaftoe Crags | South Northumberland | yes | 2 | 1 |
| NZ0599 | Garleigh Moor | South Northumberland | yes | 4 | 0 |
| NZ0632 | South-west of Doctor's Gate | Durham | no | 0 | 0 |
| NZ0666 | Bogle Burn | South Northumberland | yes | 1 | 0 |
| NZ0672 | How Burn, Fenwick | South Northumberland | yes | 1 | 1 |
| NZ0683 | Corridge | South Northumberland | yes | 1 | 1 |
| NZ0691 | Ewesley Gill | South Northumberland | yes | 2 | 0 |
| NZ0786 | Angerton Lake | South Northumberland | yes | 2 | 0 |
| NZ0825 | Copley | Durham | no | 0 | 0 |
| NZ0826 | Lunton Hill | Durham | no | 0 | 0 |
| NZ0827 | Crake Scar Farm | Durham | no | 0 | 0 |
| NZ0834 | Shull Bank | Durham | no | 0 | 0 |
| NZ0924 | Gibbsneese Plantation | Durham | yes | 1 | 0 |
| NZ1137 | Thornley | Durham | no | 0 | 0 |
| NZ1142 | Broomshiels Hall | Durham | yes | 2 | 1 |
| NZ1229 | Little Burn | Durham | yes | 1 | 0 |
| NZ1248 | Knitsley | Durham | no | 0 | 0 |
| NZ1289 | West of Stanton | South Northumberland | yes | 2 | 0 |
| NZ1362 | Greenside and Fell Farm | Durham | yes | 2 | 1 |
| NZ1376 | Cuthburt's Nook | South Northumberland | yes | 1 | 0 |
| NZ1398 | Weldon | South Northumberland | yes | 3 | 0 |
| NZ1416 | Winston | Durham | yes | 3 | 2 |
| NZ1450 | Iveston | Durham | yes | 1 | 0 |
| NZ1464 | Barmoor | Durham | yes | 1 | 0 |
| NZ1534 | south-west of Crook | Durham | no | 0 | 0 |
| NZ1538 | Billy Hill | Durham | yes | 2 | 1 |
| NZ1552 | north-west of Annfield Plain | Durham | yes | 1 | 0 |
| NZ1570 | Darras Hall | South Northumberland | yes | 3 | 0 |
| NZ1580 | South of Shilvington | South Northumberland | yes | 1 | 1 |
| NZ1583 | South East of Molesden | South Northumberland | yes | 1 | 0 |
| NZ1590 | Abshiel | South Northumberland | yes | 3 | 0 |
| NZ1644 | Click-Em-Inn Farm | Durham | yes | 2 | 0 |
| NZ1758 | Gibside | Durham | yes | 4 | 1 |
| NZ1826 | West Aukland | Durham | yes | 1 | 0 |
| NZ1838 | Birk's Wood | Durham | yes | 2 | 0 |
| NZ1872 | Prestwick | South Northumberland | yes | 4 | 0 |
| NZ1915 | Low Field | Durham | yes | 1 | 0 |
| NZ1932 | Hunwick | Durham | no | 0 | 0 |
| NZ1961 | Derwent, Dam head | Durham | yes | 4 | 1 |
| NZ1987 | Fulbeck Grange | South Northumberland | yes | 3 | 0 |
| NZ2027 | Green Lane, Bishop Auckland | Durham | no | 0 | 1 |
| NZ2098 | North of Eshott | South Northumberland | no | 1 | 0 |
| NZ2121 | Houghton Grange | Durham | no | 0 | 0 |
| NZ2148 | Charlaw Plantation | Durham | yes | 2 | 0 |
| NZ2171 | Havannah Nature Reserve | South Northumberland | yes | 2 | 0 |
| NZ2182 | Clifton Lane | South Northumberland | yes | 2 | 0 |
| NZ2252 | Eden Hill farm | Durham | yes | 1 | 0 |
| NZ2254 | Pockerley | Durham | yes | 1 | 0 |
| NZ2273 | Big Waters Country Park west | South Northumberland | yes | 2 | 0 |
| NZ2373 | Big Waters Country Park east | South Northumberland | yes | 2 | 2 |
| NZ2381 | Nedderton | South Northumberland | yes | 2 | 0 |
| NZ2385 | Paddock Hall Farm | South Northumberland | yes | 2 | 0 |
| NZ2435 | Claxburn Wood | Durham | yes | 2 | 0 |
| NZ2448 | Nettlesworth West | Durham | yes | 2 | 0 |
| NZ2477 | Bassington Industrial Estate | South Northumberland | yes | 2 | 0 |
| NZ2830 | Chilton Industrial Estate | Durham | yes | 1 | 0 |
| NZ2843 | Kieper Farm | Durham | yes | 4 | 0 |
| NZ2893 | West of Cresswell | South Northumberland | yes | 6 | 1 |
| NZ2924 | High Copelaw | Durham | no | 0 | 0 |
| NZ2975 | East Cramlington pond area | South Northumberland | yes | 3 | 0 |
| NZ2985 | North Seaton Colliery | South Northumberland | yes | 3 | 0 |
| NZ2987 | Summerhouse Lane | South Northumberland | yes | 2 | 0 |
| NZ3129 | Nunstainton East | Durham | yes | 1 | 0 |
| NZ3143 | Broomside | Durham | yes | 2 | 0 |
| NZ3213 | Morton Park | Durham | yes | 1 | 0 |
| NZ3219 | Moor House | Durham | yes | 0 | 1 |
| NZ3264 | Hebburn | Durham | yes | 0 | 1 |
| NZ3266 | Willington Quay | South Northumberland | yes | 2 | 0 |
| NZ3279 | Blyth South Beach | South Northumberland | yes | 2 | 0 |
| NZ3329 | Low Hardwick Farm | Durham | no | 0 | 0 |
| NZ3334 | Garmondsway | Durham | no | 0 | 0 |
| NZ3359 | Hylton Bridge | Durham | no | 0 | 0 |
| NZ3365 | Jarrow | Durham | yes | 2 | 2 |
| NZ3461 | Boldon Colliery | Durham | yes | 2 | 0 |
| NZ3524 | Rafferdene | Durham | no | 0 | 0 |
| NZ3544 | Hetton le Hill Wood | Durham | no | 0 | 0 |
| NZ3560 | Boldon Golf Club | Durham | yes | 2 | 0 |
| NZ3566 | N Sea Ferry-terminal | Durham & South Northumberland | yes | 2 | 0 |
| NZ3668 | Low Lights | Durham & South Northumberland | yes | 1 | 0 |
| NZ3671 | Cullercoats | South Northumberland | yes | 3 | 0 |
| NZ3735 | Trimdon Grange | Durham | no | 0 | 0 |
| NZ3745 | South Hetton | Durham | no | 0 | 0 |
| NZ3858 | Southwick | Durham | no | 0 | 0 |
| NZ3948 | Dalton Moor | Durham | yes | 1 | 0 |
| NZ3949 | Seaton | Durham | yes | 1 | 0 |
| NZ4022 | north-east of Carlton | Durham | no | 0 | 0 |
| NZ4029 | Lumpley's Covert | Durham | yes | 1 | 0 |
| NZ4236 | Hutton Henry | Durham | no | 0 | 0 |
| NZ4320 | Durham Road, Stockton-on-Tees | Durham | no | 0 | 0 |
| NZ4531 | Dovecote | Durham | no | 0 | 0 |
| NZ4628 | Springwell House Farm | Durham | no | 0 | 0 |
| NZ4738 | Green Stairs | Durham | yes | 1 | 1 |
| NZ4824 | Cowpen Bewley | Durham | no | 0 | 0 |
| NZ4827 | West of Greatham | Durham | no | 0 | 0 |
| NZ5027 | Graythorp | Durham | no | 0 | 0 |
| NZ5131 | Bellevue | Durham | yes | 1 | 1 |
Although the goal was to survey all 200 selected squares over the four years of the survey, 35 were not surveyed and a further two were surveyed, but incompletely (Fig.
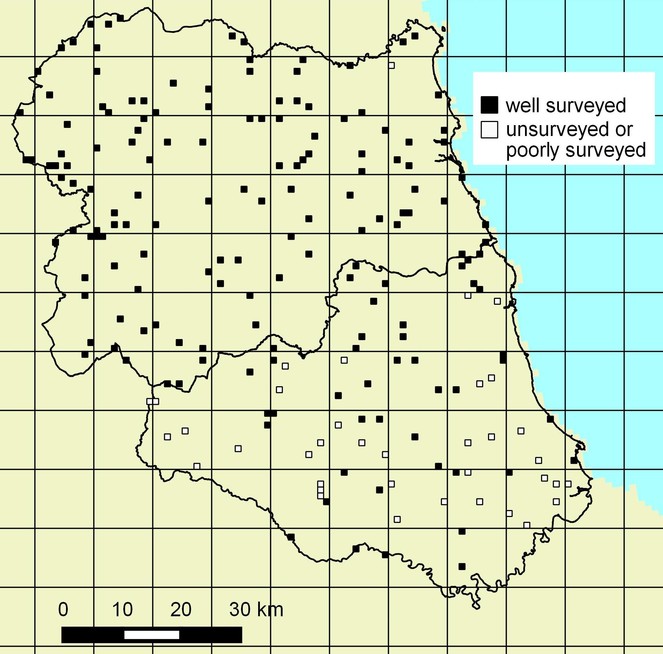
The distribution of randomly selected grid squares in Durham and South Northumberland. Selected sites that remained unsurveyed or have been inadequately surveyed over the four years are indicated. The vice county boundary data is public sector information licensed under the Open Government Licence v3.0.
All records were reviewed by Quentin Groom and John Durkin upon arrival and questionable records were queried with the observer as soon as possible after receiving the observations. All data where entered into the database system Mapmate (Mapmate Ltd., UK). This data entry system validates the data upon entry, warning the user of potential incorrect dates, exceptional species and malformed or misplaced grid references. The Mapmate database also hold most of the historic observations of Northumberland's and Durham's flora and allows these to be mapped. Visualization of the distributions of observations was another tool used to locate potential errors. For taxa that are particularly difficult to identify specimens were sent to the BSBI's panel of referees and specialists. Determination details are provided with the records.
Geographic coverage
The survey covered the Watsonian Vice Counties of Durham and South Northumberland in north-east England. The boundary of Durham follows the course of the River Tees to the south and the Rivers Tyne and Derwent to the north where it borders South Northumberland. The boundary of South Northumberland follows the River Coquet to the north, but has a less distinct boundary to the west. It largely follows the Pennine ridge along the border with Scotland and Cumberland, but in a section it also follows the River Irthing, a tributary of the River Eden.
54.450713 and 55.368047 Latitude; -2.690092 and -1.153764 Longitude.
Taxonomic coverage
The survey covered all vascular plants and Characeae growing in the wild, whether native or alien. The taxonomy of Vascular plants follows
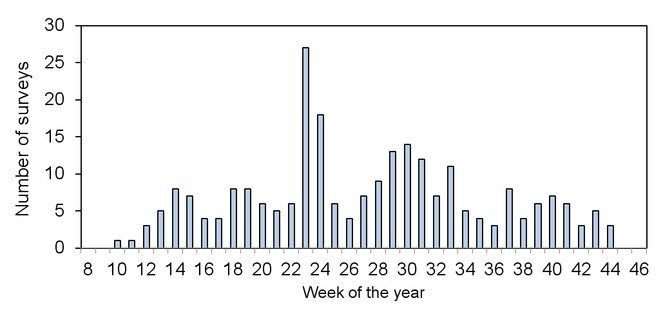
Temporal coverage
The detectability and identifiability of many species varies with the season. For this reason there was a conscious effort to survey areas more than once in different seasons. This is particular relevant to lowland areas and woodland, where spring ephemerals and agricultural weeds are only visible for a short season. Fig.
Usage rights
These data have been made available in the public domain with the hope that they will be used to improve our knowledge on the British flora. However, we expect that users of these data will conform to the normal conventions of scientific citation.
Data resources
The data source contains all survey details from the period of the survey 2010 – 2013. However, it also includes miscellaneous observations back to 1998. These additional observations which may be used to fill gaps where they exist in the surveying effort.
Additional information
Suggested use of the data
The unsurveyed grid squares are at odds with the goal of having an unbiased dataset that covers the two counties. South Northumberland was almost completely surveyed, but County Durham was incompletely surveyed with unsurveyed squares concentrated particularly in the south. There was no obvious prejudice of recorders against particular habitats; however, it appears that these unsurveyed squares are unsurveyed because they are distant from the homes of active surveyors.
Apart from ignoring these missing data, users of these data could resolve this problem in at least two ways. Analysis could be conducted only on the well-surveyed portion of the area, or surveys conducted before 2010 or after 2013 could be used to fill gaps where these observations exist. Eleven of the unsurveyed squares had surveys from between 1998 and 2009 and these surveys have been included in the dataset.
To demonstrate a potential use of these data, universal kriging has been used to interpolate DAFOR scores for Calluna vulgaris (Fig.
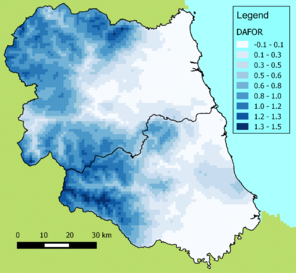
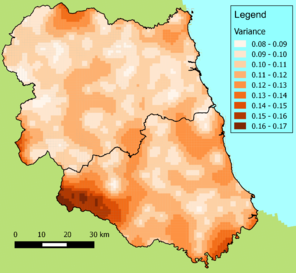
Interpolated abundance estimates of Calluna vulgaris in South Northumberland and Durham using kriging. The method is described in
b: The kriging variances of the interpolated DAFOR scores.
Acknowledgements
This paper is dedicated to the memory of the Reverend George Gordon Graham who contributed so much to our knowledge of the region's flora and passed away in 2015.
We would also like to thank all the observers and supporters of wildlife conservation in the North-east of England. Their interest in wildlife and their belief in the importance of biodiversity sustains projects such as this.
References
- A new flora of Northumberland and Durham with sketches of its climate and physical geography.Natural History Transactions of Northumberland and Durham2: ‑316[InEnglish].
- Applied Spatial Data Analysis with R.Springer,374pp. [ISBN978-0-387-78170-9] https://doi.org/10.1007/978-0-387-78171-6
- Changes in species richness and composition in European acidic grasslands over the past 70 years: the contribution of cumulative atmospheric nitrogen deposition.Global Change Biology16(1):344‑357. [InEnglish]. https://doi.org/10.1111/j.1365-2486.2009.01982.x
- Durham rare plant register 2013.self,153pp. [InEnglish]. URL: http://www.bsbi.org.uk/County_Durham_Rare_Plants_Register_2013.pdf
- Managing our forests. http://www.forestry.gov.uk/forestry/INFD-6QLL9G. Accessed on: 2015-5-10.
- the flora and vegetation of county Durham.The Durham Flora Committee and the Durham County Conservation Trust,Wallsend,526pp. [InEnglish]. [ISBN0-905362-02-0]
- The Durham Flora ― Corrigenda et Addenda.Transactions of the Natural History Society of Northumbria61:161‑167.
- Some poleward movement of British native vascular plants is occurring, but the fingerprint of climate change is not evident.PeerJ1:e77. https://doi.org/10.7717/peerj.77
- The Flora of North-East England. http://www.botanicalkeys.co.uk/northumbria/. Accessed on: 2015-10-17.
- The rare and scarce plants of South Northumberland 2013.4.Figshare,93pp. https://doi.org/10.6084/m9.figshare.1030416
- Estimation of vascular plant occupancy and its change using kriging.New Journal of Botany3(1):33‑46. https://doi.org/10.1179/2042349712y.0000000014
- Climate change and evolutionary adaptations at species' range margins.Annual Review of Entomology56(1):143‑159. [InEnglish]. https://doi.org/10.1146/annurev-ento-120709-144746
- The freshwater algal flora of the British Isles: an identification guide to freshwater and terrestrial algae. Cambridge University Press.2nd Edition,1.Cambridge University Press,896pp. [ISBN9780521193757]
- Code of conduct for the conservation and enjoyment of wild plants. www.bsbi.org.uk/Code_of_Conduct.pdf. Accessed on: 2015-5-09.
- Atmospheric nitrogen deposition in world biodiversity hotspots: the need for a greater global perspective in assessing N deposition impacts.Global Change Biology12(3):470‑476. [InEnglish]. https://doi.org/10.1111/j.1365-2486.2006.01104.x
- English naturalists from Neckam to Ray.Cambridge University Press,Cambridge,379pp. [InEnglish]. [ISBN978-1-108-01634-6]
- Safety in the field. http://www.bsbi.org.uk/SafetyInTheField.pdf. Accessed on: 2015-5-09.
- Post-war changes in arable farming and biodiversity in Great Britain.Journal of Applied Ecology39(1):157‑176. [InEnglish]. https://doi.org/10.1046/j.1365-2664.2002.00695.x
- New Flora of the British Isles.3.Cambridge University Press,Cambridge,1232pp. [InEnglish]. [ISBN9780521707725]
- Impact of nitrogen deposition on the species richness of grasslands.Science303(5665):1876‑1879. https://doi.org/10.1126/science.1094678
- The impact of agricultural intensification and land-use change on the European arable flora.Proceedings of the Royal Society B: Biological Sciences279(1732):1421‑1429. [InEnglish]. https://doi.org/10.1098/rspb.2011.1686
- Flora of Northumberland.The Natural History Society of Northumbria,Newcastle-upon-Tyne,351pp. [InEnglish]. [ISBN0952078201]
- A supplement to Flora of Northumberland.Transactions of the Natural History Society of Northumbria61:71‑160.
- The botanist's guide through the counties of Northumberland and Durham.1.S. Hodgson,Newcastle upon Tyne,123pp. [InEnglish].
- Flora of Northumberland and Durham.Pensoft,149pp. https://doi.org/10.3897/ab.e4002
- Allocating monitoring effort in the face of unknown unknowns.Ecology Letters13(11):1325‑1337. https://doi.org/10.1111/j.1461-0248.2010.01514.x
Supplementary materials
To harmonize the approach of recorders to the assignment of DAFOR abandance scores guidance notes were provided. This document contains those original guidance notes.
To harmonize the approach of recorders to the assignment of DAFOR abandance scores guidance notes were provided. This document contains those original guidance notes.
The recording card for Durham provided for surveyors to collect their observations on. The card uses abbreviated Latin names for the most common plants of the area and BRC Code numbers created by the Biological Records Centre, these numbers speed data entry.
The recording card for South Northumberland provided for surveyors to collect their observations on. The card uses abbreviated Latin names for the most common plants of the area and BRC Code numbers created by the Biological Records Centre, these numbers speed data entry.
The XSL-FO version of the Durham recording card that can be processed with Apache FOP to recreate the PDF version. It is included to allow the creation of edited versions of the card.
The XSL-FO version of the South Northumberland recording card that can be processed with Apache FOP to recreate the PDF version. It is included to allow the creation of edited versions of the card.