|
Biodiversity Data Journal :
Data Paper (Biosciences)
|
|
Corresponding author:
Academic editor: Thomas L.P. Couvreur
Received: 23 Dec 2015 | Accepted: 21 Feb 2016 | Published: 24 Feb 2016
© 2016 David Tng, Deborah Apgaua, Mason Campbell, Casey Cox, Darren Crayn, Françoise Ishida, Melinda Laidlaw, Michael Liddell, Michael Seager, Susan Laurance
This is an open access article distributed under the terms of the Creative Commons Attribution License (CC BY 4.0), which permits unrestricted use, distribution, and reproduction in any medium, provided the original author and source are credited.
Citation:
Tng D, Apgaua D, Campbell M, Cox C, Crayn D, Ishida F, Liddell M, Seager M, Laurance S (2016) Vegetation and floristics of a lowland tropical rainforest in northeast Australia. Biodiversity Data Journal 4: e7599. https://doi.org/10.3897/BDJ.4.e7599
|
|
Abstract
Background
Full floristic data, tree demography, and biomass estimates incorporating non-tree lifeforms are seldom collected and reported for forest plots in the tropics. Established research stations serve as important repositories of such biodiversity and ecological data. With a canopy crane setup within a tropical lowland rainforest estate, the 42-ha Daintree Rainforest Observatory (DRO) in Cape Tribulation, northern Australia is a research facility of international significance. We obtained an estimate of the vascular plant species richness for the site, by surveying all vascular plant species from various mature-phase, remnant and open vegetation patches within the site. We also integrate and report the demography and basal areas of trees ≥ 10 cm diameter at breast height (dbh) in a new 1-ha core plot, an extension to the pre-existing forest 1-ha plot under the canopy crane. In addition, we report for the canopy crane plot new demography and basal areas for smaller-size shrubs and treelets subsampled from nine 20 m2 quadrats, and liana basal area and abundance from the whole plot. The DRO site has an estimated total vascular plant species richness of 441 species, of which 172 species (39%) are endemic to Australia, and 4 species are endemics to the Daintree region. The 2 x 1-ha plots contains a total of 262 vascular plant species of which 116 (1531 individuals) are tree species ≥ 10 cm dbh. We estimate a stem basal area of 34.9 m2 ha-1, of which small stems (tree saplings and shrubs <10cm dbh) and lianas collectively contribute c.4.2%. Comparing the stem density-diversity patterns of the DRO forest with other tropical rainforests globally, our meta-analysis shows that DRO forests has a comparatively high stem density and moderate species diversity, due to the influence of cyclones. These data will provide an important foundation for ecological and conservation studies in lowland tropical forest.
New information
We present a floristic checklist, a lifeform breakdown, and demography data from two 1-ha rainforest plots from a lowland tropical rainforest study site. We also present a meta-analysis of stem densities and species diversity from comparable-sized plots across the tropics.
Keywords
Australia, lianas, permanent plot, rain forest, shrubs, tropical rain forest
Introduction
Tropical rainforests are globally recognized for their rich biodiversity, socio-economic importance, the ecosystems services they provide, and their potential for buffering the impacts of climate change. In terms of ameliorating the effects of climate change, tropical rainforest represent some of the most carbon-dense terrestrial ecosystems on the planet, and play a key role in global carbon cycling (
While many methods exist for measuring diversity (
The Wet Tropics bioregion covers an area of approximately 2 million ha spaning some 450 km from 15o40'S to 19o15'S along the tropical east coast of northern Australia. This bioregion encompasses a mosaic of terrestrial ecosystems ranging from sclerophyll vegetation, seasonally dry tropical forest, tropical wet forest and wetlands (
In the Daintree region near the northern end of the Wet Tropics, coastal lowland rainforest is still well preserved and contiguous with a 17,000 ha forest tract within the Daintree National Park. The lowland rainforests in the Daintree region, particularly those near Cape Tribulation have been considered by some workers to represent the ‘optimal development of rainforest in Australia’ (
As part of a program of development of the DRO to better facilitate research and educational activities, we set up an additional 1-ha monitoring plot (henceforth core plot), conducted demographic assessments of nontree life-forms from subsampled quadrats within the crane plot, and undertook a floristic survey of the entire research site to obtain an estimate of the overall floristic richness of the site. As a result of those activities, we provide here: (i) an updated analysis and synthesis of the vascular plant structure of the now 2 x 1-ha DRO plots; (ii) demographic data of the non-tree lifeforms from the crane plot, and; (iii) an analysis of the phylogenetic structure of the flora of these plots and the site. The data will form a new baseline description of the stand structure and diversity of the vegetation of the research station that will facilitate and encourage long-term ecological research, and enable comparative studies with similar plots worldwide. The core 1-ha plot has been established for the Cape Tribulation/Daintree node of the Far North Queensland SuperSite, to place the DRO inside a national plot monitoring network, the TERN SuperSite network (http://www.tern-supersites.net.au) (Karan et al, in prep.).
Sampling methods
The Daintree Rainforest Observatory (DRO) is a 42-ha property owned by the James Cook University, and is located at Cape Tribulation (16°06′S, 145°26′E, c. 50 m elevation), north-eastern Queensland, Australia (Fig.
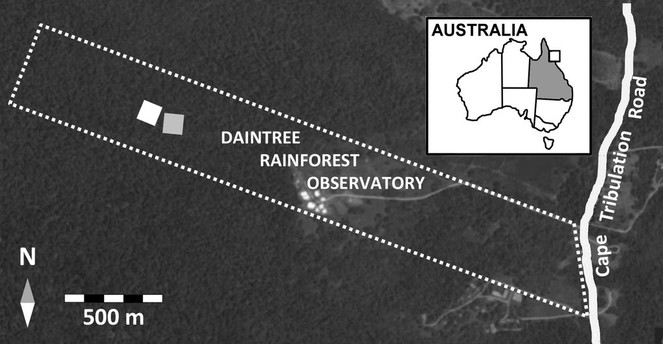
The vegetation within the DRO consists primarily of mature coastal lowland tropical rainforest. Regionally, this rainforest vegetation is described as Complex Mesophyll Vine Forest (
Within the mature rainforest estate there are two 1-ha plots located 20 m apart from each other and separated by a creek in which every tree ≥ 10 cm diameter at breast height (dbh) has been measured, tagged, and identified to species. The original circular 0.95-ha crane plot over-towered by the canopy crane was first surveyed in 2000 (
Non-tree lifeforms were subsampled within the crane plot. All individual tree saplings (≥1cm dbh) and shrubs within nine randomly assigned 10 m x 2 m quadrats were tagged and measured. For our purposes, shrubs were defined as species that do not or rarely exceed 6 m in height, and all shrub individuals ≥ 0.4 cm diameter 5 cm above ground level were marked and measured. We deviated from the more typical protocol of measuring stems ≥ 1 cm or ≥ 2.5 cm (e.g.
All lianas (≥ 1 cm diameter) were marked and measured in the crane plot using standard protocols (
Finally, to obtain an overall estimate of the vascular plant species richness, we surveyed all vascular plant species within the site using an ad hoc approach (e.g.
Analysis
We calculated a number of commonly used diversity indices for the tree stems ≥ 10 cm dbh within the combined 2 x 1-ha plot, and separately for the crane and core plots. These include the Margalef's species richness index, Shannon diversity index, Fisher’s alpha, and Pielou's and Simpson’s evenness index. Diversity indices were calculated using PAST 3.02a software (
Geographic coverage
The Daintree Rainforest Observatory (DRO) is a 42-ha property owned by the James Cook University, and is located in Cape Tribulation at approximately 50 m elevation, north-eastern Queensland, Australia (Fig.
16°06′S and ; 145°26′E.
Taxonomic coverage
Floristics and stand structure
The vascular plant survey of the Daintree Rainforest Observatory site documented 441 species (385 native, 56 non-native) representing 307 genera and 115 families. Of these, 172 species (39%) are endemic to Australia (Suppl. material
Within the 2 x 1-ha plots, we recorded 268 native species and one non-native (the fern Pityrogramma calomelanos) representing 202 genera and 87 families (Suppl. material
Diversity and aboveground biomass measures of tree stems ≥ 10 cm diameter at breast height from the Daintree Rainforest Observatory 2 x 1-ha lowland rainforest plots. S = total number of species, n = number of stems, d = Margalef's species richness index, H' = Shannon diversity index, J' = Pielou's evenness index, E = Simpsons evenness index, BA = tree basal area (m2 ha-1).
|
S |
N |
D |
H' |
F |
J' |
E |
BA |
|
|
Total plots (2 x 1-ha) |
116 |
1531 |
15.83 |
3.779 |
29.25 |
0.792 |
0.959 |
66.8 |
|
Crane plot (1-ha) |
85 |
698 |
12.61 |
3.608 |
24.29 |
0.812 |
0.951 |
33.3 |
|
Core plot (1-ha) |
81 |
833 |
11.89 |
3.379 |
22.17 |
0.769 |
0.938 |
33.5 |
The 10 most important families of tree stems ≥ 10 cm diameter at breast height from the Daintree Rainforest Observatory 2 x 1-ha lowland rainforest plots. Ni = number of individuals, Nsp = number of species, BA = basal area (m2), RDi = relative diversity, RF = relative frequency, RDo = relative dominance, FIV = family importance value.
|
Family |
Ni |
Nsp |
BA |
RDi |
RF |
RDo |
FIV |
|
Lauraceae |
201 |
16 |
12.13 |
0.15 |
0.13 |
0.18 |
45.81 |
|
Arecaceae |
284 |
3 |
4.43 |
0.03 |
0.19 |
0.07 |
27.74 |
|
Proteaceae |
102 |
5 |
9.37 |
0.04 |
0.07 |
0.14 |
24.96 |
|
Myrtaceae |
87 |
10 |
6.73 |
0.09 |
0.06 |
0.10 |
24.44 |
|
Meliaceae |
59 |
10 |
4.04 |
0.08 |
0.04 |
0.06 |
17.45 |
|
Euphorbiaceae |
155 |
3 |
2.99 |
0.03 |
0.10 |
0.04 |
17.16 |
|
Apocynaceae |
91 |
5 |
3.78 |
0.05 |
0.06 |
0.06 |
16.91 |
|
Phyllanthaceae |
149 |
2 |
3.18 |
0.02 |
0.10 |
0.05 |
16.20 |
|
Rutaceae |
65 |
5 |
3.21 |
0.05 |
0.04 |
0.05 |
14.17 |
|
Myristicaceae |
66 |
2 |
2.75 |
0.02 |
0.04 |
0.04 |
10.14 |
Demographics of the 15 most abundant species (stems ≥ 10 cm dbh) within the 2 x 1-ha Daintree Rainforest Observatory lowland rainforest plot. D = stem density, F = number of 20 m x 20 m subplots present out of 50 subplots, BA = basal area (m2), RDe = relative density, RF = relative frequency, RDo = relative dominance, IVI = importance value index (
|
Species |
D |
F |
BA |
RDe |
RF |
RDo |
IVI |
|
Cleistanthus myrianthus |
147 |
41 |
3.13 |
4.79 |
4.95 |
4.68 |
14.41 |
|
Endiandra microneura |
69 |
32 |
4.91 |
2.25 |
3.86 |
7.34 |
13.45 |
|
Cardwellia sublimis |
31 |
21 |
6.31 |
1.01 |
2.53 |
9.43 |
12.97 |
|
Normanbya normanbyi |
147 |
16 |
2.35 |
4.79 |
1.93 |
3.52 |
10.24 |
|
Alstonia scholaris |
63 |
25 |
2.03 |
2.05 |
3.02 |
3.04 |
8.11 |
|
Macaranga subdentata |
108 |
12 |
2.05 |
3.52 |
1.45 |
3.06 |
8.03 |
|
Myristica globosa |
63 |
16 |
2.65 |
2.05 |
1.93 |
3.96 |
7.94 |
|
Licuala ramsayi |
123 |
2 |
1.81 |
4.01 |
0.24 |
2.71 |
6.96 |
|
Cryptocarya mackinnoniana |
38 |
22 |
1.90 |
1.24 |
2.65 |
2.84 |
6.73 |
|
Austromuellera trinervia |
45 |
25 |
1.46 |
1.47 |
3.02 |
2.21 |
6.69 |
|
Argyrodendron peralatum |
24 |
17 |
2.02 |
0.78 |
2.05 |
3.01 |
5.85 |
|
Castanospermum australe |
14 |
9 |
2.81 |
0.46 |
1.09 |
4.20 |
5.74 |
|
Syzygium graveolens |
23 |
6 |
1.48 |
0.75 |
0.72 |
4.01 |
5.48 |
|
Litsea leefeana |
15 |
35 |
0.45 |
0.49 |
4.22 |
0.67 |
5.38 |
|
Antirhea tenuiflora |
34 |
27 |
0.44 |
1.11 |
3.26 |
0.66 |
5.03 |
A total of 71 stems of tree saplings (27 species) and 154 shrubs (12 species) were measured in the nine 20 m2 subplots in the crane plot, which extrapolates to 394 tree sapling and 856 shrub stems per ha. The tree saplings represent a subset of the tree species already in the ≥ 10 cm dbh size range, with the exception of one individual from one species (Beilschmiedia bancroftii). Among the tree saplings Cleistanthus myrianthus was the most abundant tree sapling, comprising 22.5% of the stems and 9.6% of the basal area of all tree saplings, followed by Endiandra microneura (15.5% of stems, 14.7% basal area) (Table
Demographics of tree species saplings (1-10cm dbh) within nine 20 m2 subplots within the Daintree Rainforest Observatory crane plot. D = stem density, % F = percentage of total tree sapling stems, % BA = percentage of total shrub basal area (m2).
|
Species |
D |
% F |
% BA |
|
Endiandra microneura |
11 |
15.5 |
14.7 |
|
Endiandra leptodendron |
3 |
4.2 |
13.2 |
|
Medicosma fareana |
1 |
1.4 |
10.4 |
|
Cleistanthus myrianthus |
16 |
22.5 |
9.6 |
|
Brombya platynema |
2 |
2.8 |
8.6 |
|
Siphonodon membranaceus |
6 |
8.5 |
8.0 |
|
Rockinghamia angustifolia |
4 |
5.6 |
6.1 |
|
Dysoxylum alliaceum |
2 |
2.8 |
5.3 |
|
Beilschmiedia bancroftii |
1 |
1.4 |
4.8 |
|
Myristica globosa |
3 |
4.2 |
4.6 |
|
Endiandra microneura |
11 |
15.5 |
14.7 |
|
Endiandra leptodendron |
3 |
4.2 |
13.2 |
Demographics of shrub species within nine 20 m2 subplots within the Daintree Rainforest Observatory crane plot. D = stem density, % F = percentage of total shrub stems, % BA = percentage of total shrub basal area (m2).
|
Species |
D |
% F |
% BA |
|
Haplostichanthus ramiflorus |
76 |
52.1 |
71.90 |
|
Atractocarpus hirtus |
24 |
16.4 |
7.97 |
|
Bowenia spectabilis |
22 |
15.1 |
3.06 |
|
Cordyline cannifolia |
7 |
4.8 |
4.88 |
|
Amaracarpus nematopodus |
4 |
2.7 |
5.18 |
|
Ardisia brevipedata |
4 |
2.7 |
1.76 |
|
Aglaia meridionalis |
1 |
0.7 |
0.49 |
|
Breynia stipitata |
1 |
0.7 |
0.24 |
|
Corymborkis veratrifolia |
1 |
0.7 |
0.11 |
|
Harpullia rhyticarpa |
1 |
0.7 |
0.35 |
|
Ixora biflora |
1 |
0.7 |
2.99 |
|
Pittosporum rubiginosum |
1 |
0.7 |
1.06 |
We recorded 1072 liana stems (> 1 cm dbh) with an estimated basal area of 0.924 m2 ha-1, which represented 2.7% of the total basal area for the 2 x 1-ha plots. Of the 58 canopy trees examined for liana load, 19 species of lianas (32% of all liana species documented from the crane plot) were recorded. In particular, Merremia peltata (Convolvulaceae), Entada phaseoloides (Fabaceae) and Tetrastigma nitens (Vitaceae) were present on a large percentage of the sampled trees (84, 52 and 43% host trees respectively), and exhibited high mean covers (24.5, 8.4 and 4.1% respectively).
Endemism and biogeography
Endemism was primarily represented at the species level and by trees, with 168 species (45% of native species) endemic to Australia, and among the tree stems ≥ 10cm dbh in the 2 x 1-ha plots, 63 (54.7%) species are endemic to Australia. These patterns are largely attributable to tree species within the families Lauraceae, Myrtaceae, Proteaceae and Sapindaceae (Table
Usage rights
This dataset can be freely used, provided it is cited.
Data resources
| Column label | Column description |
|---|---|
| Species | Species names |
| Family | Botanical family |
| Lifeform | Lifeform |
| Status | Exotic, native or endemic status in Australia |
| Plot Presence or Abundance | Plot Presence or Abundance |
Additional information
Discussion
We synthesize and report the floristics and vegetation structure of tropical lowland rainforest within the Daintree Rainforest Observatory. Our synthesis takes into account the contribution of less commonly studied lifeforms (e.g. shrubs and lianas) to biodiversity and woody basal area for future plot comparisons.
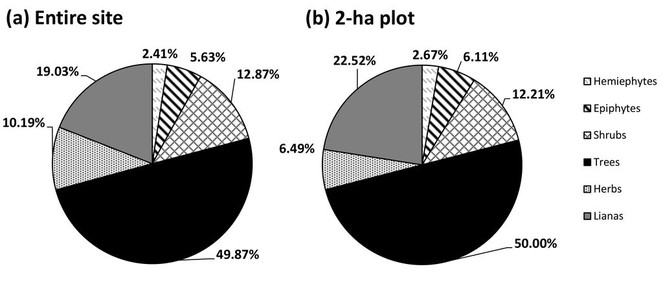
Lifeform composition studies are generally uncommon for tropical rainforests, but
The full floristics within the 2 x 1-ha plots encompasses most of the primary rainforest species within the DRO site, and the remaining species found within the site represent mostly species of secondary rainforests. However, floristic lists from a nearby CSIRO 0.5 ha plot at Oliver Creek (16°08'S, 145°26'E) reveal the presence of a number of different species (
Nevertheless, the floristics of the 2 x 1-ha lowland rainforest plots reflect the high species endemism found within the Wet Tropics World Heritage Area tropical rainforest in Australia, with the prevalence of Lauraceae, Myrtaceae, Proteaceae and Sapindaceae typical of the region (e.g.
Despite high endemism, the recorded species richness and Fisher’s alpha of tree stems ≥ 10 cm dbh is relatively low compared to Neotropical and South-East Asian plots of similar altitudes (
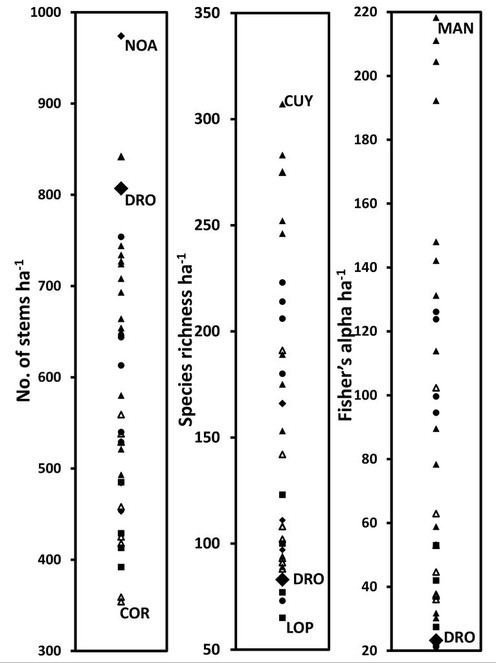
Relative ranking of the Daintree Rainforest Observatory (DRO) plots (1 ha averages) (large closed diamonds), Cape Tribulation, Australia in stem density (a), species richness (b), and Fisher’s alpha diversity indices (c), compared with selected tropical rainforest 1-ha monitoring plots in Australasia (including Papua New Guinea) (closed diamond) Southeast Asia (closed circles), Africa (squares), Central America (open triangles) and South America (closed triangles). Fisher’s alpha diversity takes into account the density of stem per species. For each graph, the highest and lowest sites are indicated (COR: Corcovado, Costa Rica; CUY: Cuyabeno, South America; GUN: Gunung Mulu, Southeast Asia; LOP: Lopé, Africa; MAN: Manaus, Brazil; NOA: Noah Creek, Australia). The data was compiled from
Indeed, cyclones play a strong role in shaping the structure and composition of tropical forests in the region (
Additional datasets
The current research aligns with a stimulus to enhance the research and teaching infrastructure of the facility, and we have built a reference herbarium of over 1200 specimens representing c.1000 species from the Daintree-Cape Tribulation region, and also voucher specimens from this study housed within the facility. Recently, a rainfall exclusion experiment has been set up under a 0.5 ha section under the crane plot to monitor tree and shrub responses to rainfall exclusion (
Acknowledgements
We thank the staff at the Daintree Rainforest Observatory for help with site and crane access, and Claudia Paz, Mari Pasanen, Alicia Taifer, Averi Marciano and Michael Lee for help with fieldwork, and Andrew Ford for help with plant identifications. This work was supported by a Discovery grant (FT130101319) from the Australian Research Council to Susan Laurance, and the Australian SuperSite Network, part of the Australian Government's Terrestrial Ecosystem Research Network (www.tern.org.au).
References
- Functional traits and water transport strategies in lowland tropical rainforest trees.PLOS ONE10(6):e0130799. https://doi.org/10.1371/journal.pone.0130799
- Leaf Level Physiology, Chemistry and Structural Traits, Far North Queensland Rainforest SuperSite, Daintree, 2012.www.supersites.net.au/knb/metacat/lloyd.258.21/html. Accessed on: 2015-12-15.
- Global variability in leaf respiration in relation to climate, plant functional types and leaf traits.New Phytologist206(2):614‑636. https://doi.org/10.1111/nph.13253
- Bostock PD, Holland AE (2013) Introduction to the Census of the Queensland Flora 2013. Queensland Department of Science. formation Technology, Innovation and the Arts, Brisbane.
- Any which way will do - the pollination biology of a northern Australian rainforest canopy tree (Syzygium sayeri; Myrtaceae).Botanical Journal of the Linnean Society149(1):69‑84. https://doi.org/10.1111/j.1095-8339.2005.00430.x
- Long-term stem inventory data from tropical rain forest plots in Australia.Ecology95(8):2362‑000. https://doi.org/10.1890/14-0458r.1
- Floristics, stand structure and aboveground biomass of a 25-ha rainforest plot in the Wet Tropics of Australia.Journal of Tropical Forest Science26:543‑553.
- Climate Data Online. http://www.bom.gov.au/climate/data/index.shtml. Accessed on: 2015-5-22.
- Decline of a biome: evolution, contraction, fragmentation, extinction and invasion of the Australian mesic zone biota.Journal of Biogeography38(9):1635‑1656. https://doi.org/10.1111/j.1365-2699.2011.02535.x
- Campbell D (1994) Scale and patterns of community structure in Amazonian forests. In: Edwards PJ, May RM, Webb NR (Eds) Large-scale ecology and conservation biology.Blackwells,Oxford,19pp.
- Are tropical forests an important global carbon sink?: revisiting the evidence from long-term inventory plots.Ecological Applications12:3‑7. https://doi.org/10.1890/1051-0761(2002)012[0003:ATFAIC]2.0.CO;2
- Tropical Forest Census Plots.Springer-Verlag,Berlin,211pp. https://doi.org/10.1007/978-3-662-03664-8
- Impacts of warming on tropical lowland rainforests.Trends in Ecology & Evolution26(11):606‑613. https://doi.org/10.1016/j.tree.2011.06.015
- The Sahul-Sunda floristic exchange: dated molecular phylogenies document Cenozoic intercontinental dispersal dynamics.Journal of Biogeography42(1):11‑24. https://doi.org/10.1111/jbi.12405
- The Vegetation of Wisconsin: an ordination of Plant Communities.University of Winsconsin Press,Madison,640pp.
- Ewel JJ, Bigelow SW (1996) Plant life-forms and tropical ecosystem functioning. In: Orians G, Dirzo R, Hall C (Eds) Biodiversity and ecosystem processes in tropical forests.26pp. https://doi.org/10.1007/978-3-642-79755-2_6
- Alternative height strategies among 45 dicot rain forest species from tropical Queensland, Australia.Journal of Ecology93(3):521‑535. https://doi.org/10.1111/j.0022-0477.2005.00992.x
- Contribution of nontrees to species richness of a tropical rain forest.Biotropica19(2):149. https://doi.org/10.2307/2388737
- Diversity and biogeography of neotropical vascular epiphytes.Annals of the Missouri Botanical Garden74(2):205. https://doi.org/10.2307/2399395
- A standard protocol for liana censuses 1.Biotropica38(2):256‑261. https://doi.org/10.1111/j.1744-7429.2006.00134.x
- Goosem S, Morgan G, Kemp JE (1999) Wet tropics. In: Sattler P, Williams R (Eds) The conservation status of Queensland's bioregional ecosystems.Environmental Protection Agency,Brisbane,73pp.
- Efficient floristic inventory for the assessment of tropical tree diversity: A comparative test of four alternative approaches.Forest Ecology and Management237:564‑573. https://doi.org/10.1016/j.foreco.2006.10.002
- The CSIRO Rainforest Plots of North Queensland: Site, Structural, Floristic and Edaphic Descriptions.Cooperative Research Cen-tre for Tropical Rainforest Ecology and Management,Cairns,227pp.
- Cyclone tolerance in New World Arecaceae: biogeographic variation and abiotic natural selection.Annals of Botany102(4):591‑598. https://doi.org/10.1093/aob/mcn132
- Mosaics of canopy openness induced by tropical cyclones in lowland rain forests with contrasting management histories in northeastern Australia.Journal of Tropical Ecology16:883‑894. https://doi.org/10.1017/s0266467400001784
- PAST-Palaeontological statistics.Palaeontologia Electronica4:1‑31. URL: www. uv. es/~ pardomv/pe/2001_1/past/pastprog/past. pdf
- The Australian Soil Classification.CSIRO,Melbourne,152pp.
- Pre-clearing vegetation of the coastal lowlands of the Wet Tropics Bioregion, North Queensland.Cunninghamia10(2):285‑329.
- Visitor assemblages at flowers in a tropical rainforest canopy.Austral Ecology32(1):29‑42. https://doi.org/10.1111/j.1442-9993.2007.01733.x
- Temporal and spatial variation in an Australian tropical rainforest.Austral Ecology32(1):10‑20. https://doi.org/10.1111/j.1442-9993.2007.01739.x
- A raincoat for a rainforest.Australasian Science36:20‑22.
- Influence of soils and topography on Amazonian tree diversity: a landscape-scale study.Journal of Vegetation Science21(1):96‑106. https://doi.org/10.1111/j.1654-1103.2009.01122.x
- Impacts of wind disturbance on fragmented tropical forests: A review and synthesis.Austral Ecology33(4):399‑408. https://doi.org/10.1111/j.1442-9993.2008.01895.x
- Floristic and structural diversity of mixed dipterocarp forest in Lambir Hills National Park, Sarawak, Malaysia.Journal of Tropical Forest Science14(3):379‑400.
- Tropical Forest Ecology: A View from Barro Colorado Island.Oxford University Press,264pp.
- Assessing the above-ground biomass of a complex tropical rainforest using a canopy crane.Austral Ecology32(1):43‑58. https://doi.org/10.1111/j.1442-9993.2007.01736.x
- An International Union for Conservation of Nature risk assessment of coastal lowland rainforests of the Wet Tropics Bioregion, Queensland, Australia.Austral Ecology40(4):373‑385. https://doi.org/10.1111/aec.12263
- Cyclone damage to tropical rain forests: species- and community-level impacts.Austral Ecology33(4):432‑441. https://doi.org/10.1111/j.1442-9993.2008.01898.x
- No evidence for long-term increases in biomass and stem density in the tropical rain forests of Australia.Journal of Ecology101(6):1589‑1597. https://doi.org/10.1111/1365-2745.12163
- Forest canopy studies as an emerging field of science.Annals of Forest Science68(2):217‑224. https://doi.org/10.1007/s13595-011-0046-6
- Stem and leaf hydraulic properties are finely coordinated in three tropical rain forest tree species.Plant, Cell & Environment38(12):2652‑2661. https://doi.org/10.1111/pce.12581
- Universal hydraulics of the flowering plants: vessel diameter scales with stem length across angiosperm lineages, habits and climates.Ecology Letters17(8):988‑997. https://doi.org/10.1111/ele.12302
- Forest Structure in low-diversity tropical forests: a study of Hawaiian wet and dry Forests.PLoS ONE9(8):e103268. https://doi.org/10.1371/journal.pone.0103268
- Efficient plot-based floristic assessment of tropical forests.Journal of Tropical Ecology19(6):629‑645. https://doi.org/10.1017/s0266467403006035
- Drought sensitivity of the Amazon rainforest.Science323(5919):1344‑1347. https://doi.org/10.1126/science.1164033
- Species richness and density of ground herbs within a plot of lowland rainforest in north-west Borneo.Journal of Tropical Ecology12(2):177. https://doi.org/10.1017/s0266467400009408
- Comparing above-ground biomass among forest types in the Wet Tropics: Small stems and plantation types matter in carbon accounting.Forest Ecology and Management264:228‑237. https://doi.org/10.1016/j.foreco.2011.10.016
- The recording of structure, life form and flora of tropical forest communities as a basis for their classification.The Journal of Ecology28(1):224‑239. https://doi.org/10.2307/2256171
- Bark functional ecology: evidence for tradeoffs, functional coordination, and environment producing bark diversity.New Phytologist201(2):486‑497. https://doi.org/10.1111/nph.12541
- Supplemental protocol for liana censuses.Forest Ecology and Management255:1044‑1049. https://doi.org/10.1016/j.foreco.2007.10.012
- Total carbon stocks in a tropical forest landscape of the Porce region, Colombia.Forest Ecology and Management243:299‑309. https://doi.org/10.1016/j.foreco.2007.03.026
- Stand structure and floristic composition of a primary lowland dipterocarp forest in East Kalimantan.Journal of Tropical Forest Science11:1.
- Large trees drive forest aboveground biomass variation in moist lowland forests across the tropics.Global Ecology and Biogeography22(12):1261‑1271. https://doi.org/10.1111/geb.12092
- Extent and timing of floristic exchange between Australian and Asian rain forests.Journal of Biogeography38(8):1445‑1455. https://doi.org/10.1111/j.1365-2699.2011.02519.x
- Stocker GC (1988) Tree species diversity in rainforests - establishment and maintenance. In: Kitching R (ed) The ecology of Australia's wet tropics. Proc Ecol Soc Australia. Surrey Beatty and Sons, Chipping Norton, Australia.15.39-47pp.
- Australian tropical forest canopy crane: New tools for new frontiers.Austral Ecology32(1):4‑9. https://doi.org/10.1111/j.1442-9993.2007.01740.x
- Stork NE, Cermak M (2003) Australian Canopy Crane: getting on top of the World’s last biological frontier. In: Basset Y, Horlyck V, Wright SJ (Eds) Studying Forest Canopies from Above: The International Canopy Crane Network.Smithsonian Tropical Research Institute,Panama,7pp.
- The vegetation of the humid tropical region of North Queensland.CSIRO,Melbourne,124pp.
- Immediate impacts of a severe tropical cyclone on the microclimate of a rain-forest canopy in north-east Australia.Journal of Tropical Ecology20(5):583‑586. https://doi.org/10.1017/s0266467404001622
- Drought, fire and tree survival in a Borneo rain forest, East Kalimantan, Indonesia.Journal of Ecology93(1):191‑201. https://doi.org/10.1111/j.1365-2745.2004.00954.x
- Cyclones as an ecological factor in tropical lowland rain-forest, North Queensland.Australian Journal of Botany6(3):220‑228. https://doi.org/10.1071/bt9580220
- Bird Survey Data, Far North Queensland Rainforest SuperSite, Daintree, 2014. TERN Australian SuperSite Network. www.supersites.net.au/knb/metacat/supersite.13.5/html. Accessed on: 2015-12-15.
- Vertebrate Fauna Biodiversity Monitoring, Far North Queensland Rainforest SuperSite, Daintree, CTBCC, 2015. TERN Australian SuperSite Network. www.supersites.net.au/knb/metacat/supersite.115.3/html. Accessed on: 2015-12-15.
- Broad anatomical variation within a narrow wood density range—a study of twig wood across 69 Australian angiosperms.PLOS ONE10(4):e0124892. https://doi.org/10.1371/journal.pone.0124892
Supplementary material
Species within the Daintree Rainforest Observatory and stem abundances (≥ 10 cm dbh) within the 2 x 1-ha monitoring plots. The presence of nontree lifeforms are indicated with a (+).