|
Biodiversity Data Journal :
Data Paper (Biosciences)
|
|
Corresponding author:
Academic editor: Pavel Stoev
Received: 15 Jun 2016 | Accepted: 06 Sep 2016 | Published: 13 Sep 2016
© 2016 Gordon Paterson, Sara Albuquerque, Vladimir Blagoderov, Stephen Brooks, Steve Cafferty, Elisa Cane, Victoria Carter, John Chainey, Robyn Crowther, Lyndsey Douglas, Joanna Durant, Liz Duffell, Adrian Hine, Martin Honey, Blanca Huertas, Theresa Howard, Rob Huxley, Ian Kitching, Sophie Ledger, Caitlin McLaughlin, Geoff Martin, Gerardo Mazzetta, Malcolm Penn, Jasmin Perera, Mike Sadka, Elisabetta Scialabba, Angela Self, Darrell Siebert, Chris Sleep, Flavia Toloni, Peter Wing
This is an open access article distributed under the terms of the Creative Commons Attribution License (CC BY 4.0), which permits unrestricted use, distribution, and reproduction in any medium, provided the original author and source are credited.
Citation:
Paterson G, Albuquerque S, Blagoderov V, Brooks S, Cafferty S, Cane E, Carter V, Chainey J, Crowther R, Douglas L, Durant J, Duffell L, Hine A, Honey M, Huertas B, Howard T, Huxley R, Kitching I, Ledger S, McLaughlin C, Martin G, Mazzetta G, Penn M, Perera J, Sadka M, Scialabba E, Self A, Siebert D, Sleep C, Toloni F, Wing P (2016) iCollections – Digitising the British and Irish Butterflies in the Natural History Museum, London. Biodiversity Data Journal 4: e9559. https://doi.org/10.3897/BDJ.4.e9559
|
|
Abstract
Background
The Natural History Museum, London (NHMUK) has embarked on an ambitious programme to digitise its collections . The first phase of this programme has been to undertake a series of pilot projects that will develop the necessary workflows and infrastructure development needed to support mass digitisation of very large scientific collections. This paper presents the results of one of the pilot projects – iCollections. This project digitised all the lepidopteran specimens usually considered as butterflies, 181,545 specimens representing 89 species from the British Isles and Ireland. The data digitised includes, species name, georeferenced location, collector and collection date - the what, where, who and when of specimen data. In addition, a digital image of each specimen was taken. This paper explains the way the data were obtained and the background to the collections which made up the project.
New information
Specimen-level data associated with British and Irish butterfly specimens have not been available before and the iCollections project has released this valuable resource through the NHM data portal.
Keywords
Collection digitisation, butterflies, British Isles, Ireland, mass digitsation, collections
Introduction
The Natural History Museum, London (NHMUK) has embarked on an ambitious programme to digitise its collections, some 80 million specimens (see http://www.nhm.ac.uk/our-science/our-work/digital-museum.html for background and details). The iCollections project was developed as part of this programme with the aim of developing the necessary data pipelines and digitisation workflows to undertake a mass digitisation project. In addition to the aim of digitising a large collection, iCollections was also established to test what systems would have to be developed and whether the existing infrastructure would be able to deal with relatively large volumes of data in a timely and secure way. This paper provides some of the background on how the British and Irish butterfly collections were digitised and the dataset created.
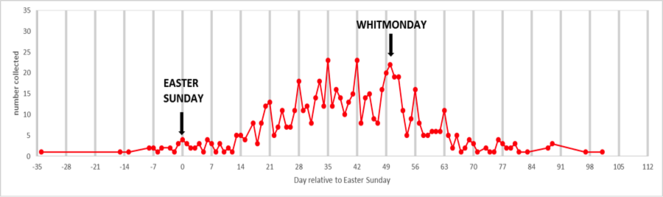
The data collected has been used by Brooks et al. (in press, Ecography) to examine the phenology of British butterflies between 1880 and 1980.
General description
Background to the iCollections project
The NHMUK's British and Irish Lepidoptera collection is a large, comprehensive collection of British and Irish Lepidoptera, containing a wealth of material of both scientific and historic importance. The British and Irish specimens are separated from the main collection, making it easier to undertake a project of sufficient size to test various digitisation workflows. The discrete nature of the collection also made pre-digitisation preparation easier.
A number of factors were assessed that highlighted this collection as being an appropriate vehicle to develop and test mass digitization workflows of the NHMUK collections. Firstly, the project needed a coherent collection that would provide sufficient numbers of specimens to establish, test and develop suitable mass digitisation pipelines. Secondly, the collection needed to be of sufficient size to make an impact and to deliver a large volume of data. Thirdly, the project needed to be scientific and culturally coherent and credible – our entire British and Irish collections are of interest to scientists, conservationists and the general public. Fourthly, data produced could be used to address wider issues. For example have species ranges, flight times or morphology changed through time? Are they affected by climate change? What have we lost and what have we gained in terms of species? What species have been recorded in my area? Finally, from a collections management perspective – what do we have, how many, and where are the gaps?
A pilot study of four species of British and Irish butterflies carried out by
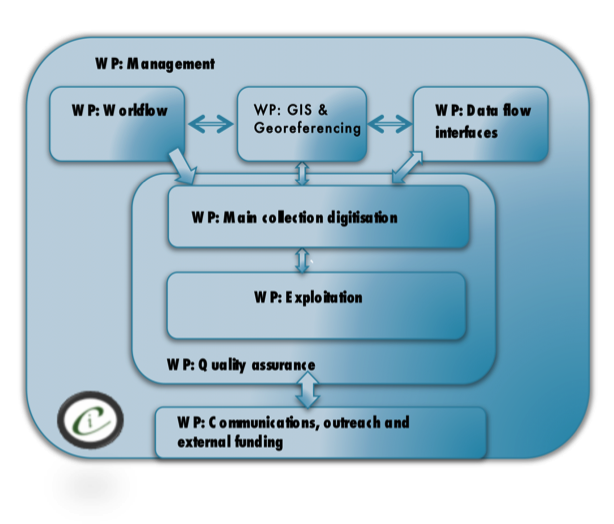
From early in the project development it was clear that expertise in a range of specialisms was going to be required for the project. Fig.
Project description
iCollections: British and Irish Lepidoptera
Roles in the project
Chair: Gordon L J Paterson;
Collections management: Geoff Martin, Martin Honey, John Chainey, Blanca Huertas, Theresa Howard, Rob Huxley;
QA/QC KE EMu: Darrell Siebert;
Workflows: Vladimir Blagoderov, Steve Cafferty;
Database/interfaces: Adrian Hine, , Mike Sadka;
Data operations and Automated processing of images: Chris Sleep; Research: Steve Brooks, Ian Kitching;
Digitisation Team: Sara Albuquerque, Elisa Cane, Robyn Crowther, Lyndsey, Douglas, Joanna Durant, Sophie Ledger, Gerardo Mazzetta, Jasmin Perera, Elisabetta Scialabba, Flavia Toloni, Peter Wing;
Georeferencing/GIS: Malcolm Penn, Caitlin McLaughlin, Liz Duffell;
Administration and project management: Victoria Carter.
Digitisation process
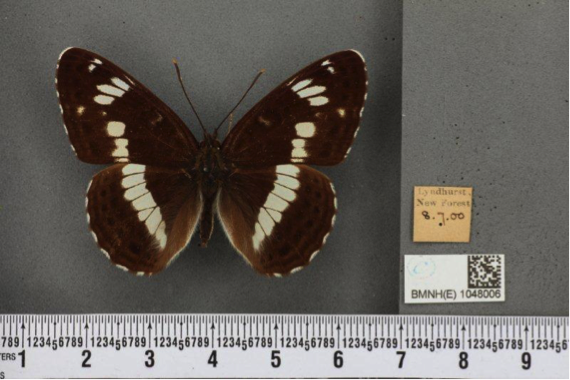
The digitisation process has three stages. The first is imaging. Specimens are photographed in a unit tray specially constructed to allow the specimens to be imaged together with their labels.
Fig.
File handling and storage
The image files were placed into a shared folder structure organised to represent physical storage location and taxonomy. Once ready, a file system crawling process was invoked to carry out the initial steps: automatically cropping the label section, identifying barcodes and seeding the initial metadata to a database ready to support the transcription step. The files and associated data were then available to be ingested into the Museum’s collection management system.
The folder structure was organised to minimise the amount of manual entry needed during image capture, which in turn helps to maintain the rate at which the imaging can take place, and reduce the potential for initial capture errors. Fig.
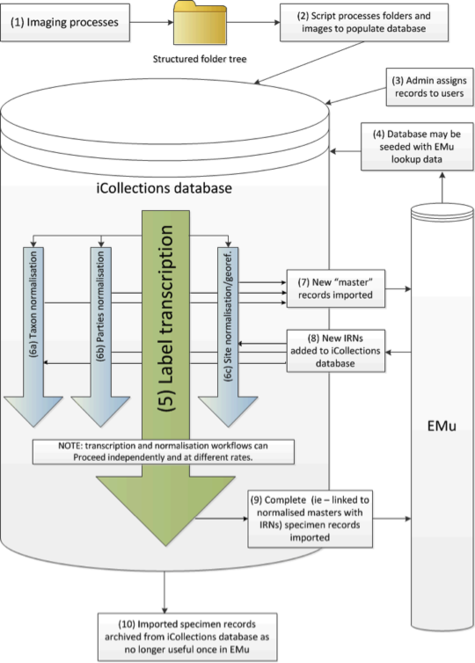
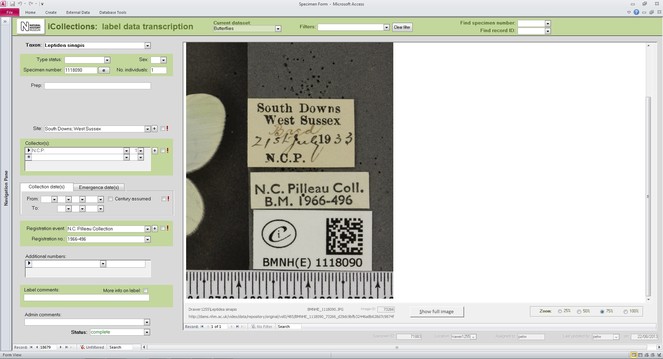
The label information selected to be transcribed was atomised into different fields of a purpose designed MS Access™ transcription interface (the files were in a MS SQL Server™ database), focusing mainly on the ‘what’ (fields for taxonomy and primary type status, if any), ‘when’ (fields for date of collection and/or emergence), ‘where’ (site field), and ‘who’ (fields for collector and registration event). This information was transcribed by the digitisers without personal interpretation or conjecture. The interface allows the ingestion of multiple images when the information to be transcribed is placed on both sides of the labels; a visual cue warns the digitiser when this is the case.
Locality and collector names can be written in many, very different styles or using slightly different spellings (variants), which were first transcribed verbatim and then harmonised (i.e., converted into a standardised format) at a later stage during georeferencing and migration into the NHM’s Collections Management System (KE EMu™). Moreover, dates (either Fig.
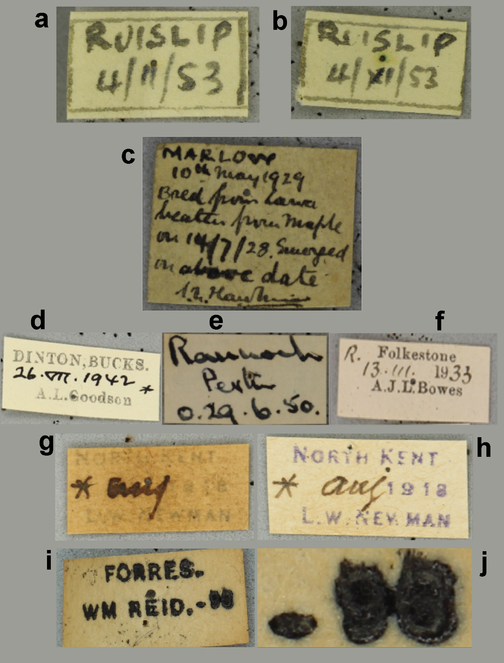
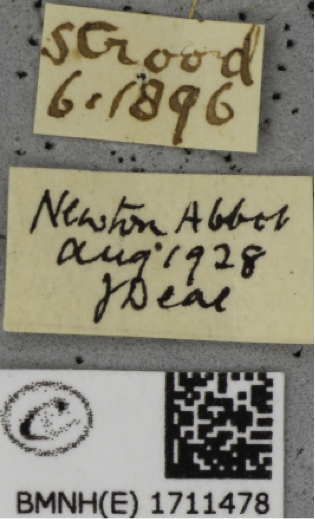
The label problem.
a) and b) Transcription of ambiguous dates as exemplified by two handwritten labels from the locality (town) of Ruislip pertaining to different specimens; the middle number (month) on the date from the left label could be interpreted as February or November, depending on whether the number was written as a Roman numeral or not. The label on the right (b) has been handwritten by the same person and shows unequivocally that the middle number is indeed a Roman numeral but this finding also suggests that the collector also wrote 11 in the other label. c), d), e) and f) Transcription of emergence and collection dates. (c) Collection and emergence dates clearly stated on the handwritten label. (d) Emergence date inferred by known symbols (e.g., crosses and asterisks) and abbreviations or initials (e.g., ‘B.’ standing for ‘Bred’, ‘l.’ standing for ‘larva’), (e) ‘o’ standing for ‘ova’, or (f) ‘R.’ standing for ‘reared’. g) and h) Transcription of faded information from (g) barely legible label produced with a mimeograph; (h) A similar type of label in a better conservation state. i) and j) Transcription of a barely legible, smudged number (corresponding to the year that the specimen was collected) from a printed label was easily performed by zooming in its corresponding image, as shown in the enlarged detail on the right. It became apparent that the stamped number was 96, and consequently the collection year was assumed to be 1896 (century inferred based on known period of activity for W.M. Reid).
Examples of the range of problems encountered when transcribing specimen labels is given in Fig.
Developing interfaces for data capture.
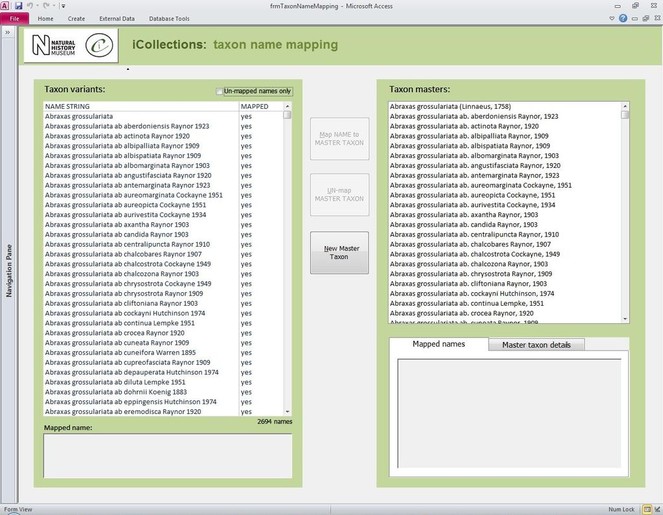
Transcription interface. To capture the data on the labels a series of interfaces for transcription were developed. The transcription interface operates against a normalised database, which reduces data capture effort (keyed values are available to all transcribers) and transcription errors (once keyed, data values exist only once in the system, and can be selected as appropriate rather than being re-keyed). Three types of records were selected and had look-up lists developed: taxa, sites (and georeferencing) and Parties–collector and/or donor (Figs
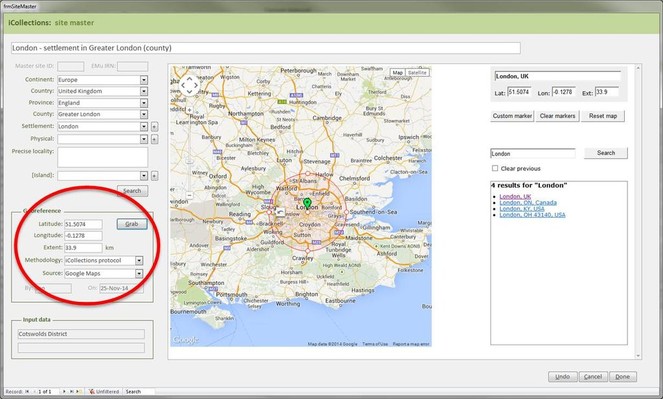
The interfaces were designed using MS Access 2010 ™. This software was selected for a number of reasons, in particular its flexibility. MS Access 2010 ™ is an excellent front end for MS SQL Server ™ and is a a recognised industry standard with dedicated record handling environment, providing many conveniences and thereby facilitating rapid development.
In developing the interfaces great care was taken to experiment with various facets of the interface, for example, changing the colours around the interface fields so that they were more easily recognised and separated. This phase of developing and trialling the interfaces relied on good communication between the digitisation team and the interface developers. It was clear that small changes could achieve large efficiency gains by making the interface more intuitive to use and organising the fields in ways that improve the flow (see) .
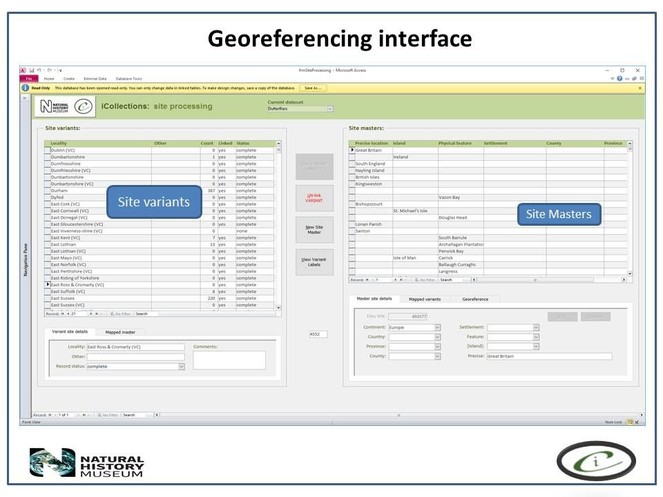
Georeferencing
It is important that the entire georeferencing process follows a set of guidelines that are designed to reduce georeferencing error and increase repeatability. The NHM georeferencing guidelines provide clear instructions on how to approach and georeference different spatial locations, e.g. mountains, rivers, when to use "near” and the application of standard abbreviations etc., They allowed the team to maintain geographical standards based on WGS 1984 Decimal Degrees and importantly, ensure consistency was carried forward. The guidelines are continuously updated as project digitise other collections across the NHM, so that they provide a clear set of instructions of how to georeference specific localities and their extents, thereby, providing a geographical standard, based on our NHM data and best practise from other similar organisations.
Finally, the whole process of georeferencing at the NHM was designed to clean the data, normalisation/harmonisation and map site variants to unambiguous master records reducing the number of site records that need to be imported into the collections management data system, standardise while following both NHM and geographical standards (e.g. ISO 2015). This process of reducing duplication and error to produce a site master reduced the final tally of iCollection sites georeferenced by approximately 50%.
Georeferencing process
The Georeferencing process was split into five broad phases.
- First phase. During this stage only sites with at least 5 specimens collected were georeferenced, (this enables sites with many specimens to be georeferenced quickly, these can account for 60-70% of a collection).
- Second phase. The team split the remaining data into two parts A-M and N–Z, and no more than 15 minutes was spent on each site trying to georeference the data.
- Third phase. The remaining data were then checked by the senior georeferencer and any queries addressed and the data were then further investigated by the georeferencers and the specific curator /researcher, who provide help on any specific problem locations.
- Fourth phase. The remaining data were checked that a georeference was not obtainable and these were then noted as a un-georeferenceable in the dataset. The dataset was then checked for accuracy by taking a random 100 sites from the data and compare results.
- Fifth phase. Data were then exported and ingested into KeEMU ™ by the NHM database team.
Digitisation timings and costs
The timings to prepare the specimens, image and transcribe label information varied from 0.52 to 4.52 minutes with the modal figure around 2.4 minutes. Estimating the cost of the digitisation process depends on what is included. For example, it is possible to calculate the costs based on the funds needed to hire new staff and buy equipment But it is also possible to calculate the cost per specimen based on an assessment of all the hidden costs such as the time spent on the project by existing staff. This can lead to different estimates of the project cost and ultimately the cost of digitising each specimen. The cost per specimen based only on the hire of new staff and the purchase of new equipment was £1.17 (based on the 2015 NHM salary scales). However, if one also takes into account the time spent by in-house staff to support the project, the expense of refurbishing accommodation, hire of new staff, equipment, etc., then the true cost per specimen is nearer £2.02. It is important to be clear about what costs are being assessed and included when the cost per specimen is given.
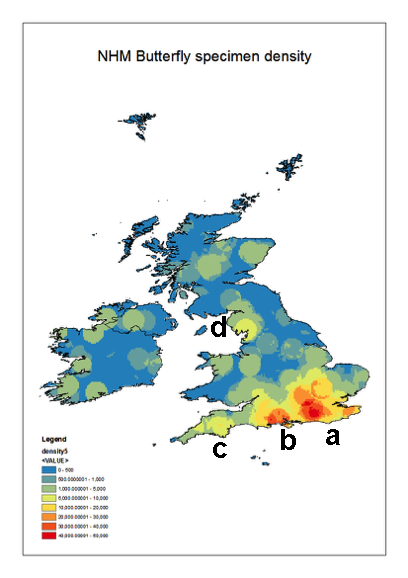
Geographic coverage
The collections cover most of the British Isles and Ireland. However, there are distinct ‘hotspots’ particularly along the south coast of England. These reflect the areas frequented by the main collectors represented in the collections. The densest collecting area is around London and the Home Counties (Fig.
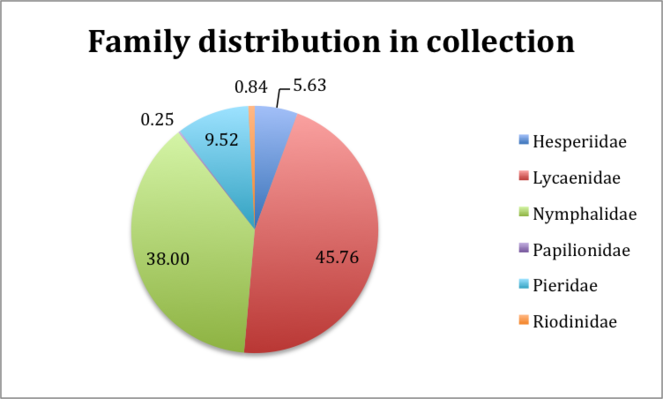
Taxonomic coverage
The Project focused on Lepidoptera from the families Lycaenidae, Nymphalidae, Pieridae, Riodinidae, Hesperiidae, Papilionidae collectively referred to in the project as butterflies. Fig.
Table 1. Species in the NHMUK British and Irish butterfly collections together with counts of the numbers of specimens of each species.
|
Agassiz number |
Scientific name |
Count |
Notes |
|
56.002 |
Iphiclides podalirius (Linnaeus, 1758) |
1 |
|
|
56.003 |
Papilio machaon Linnaeus, 1758 |
810 |
|
|
56.0031 |
Papilio xuthus Linnaeus, 1767 |
1 |
UK data |
|
57.001 |
Erynnis tages (Linnaeus, 1758) |
1215 |
|
|
57.0012 |
Pyrgus armoricanus (Oberthür, 1910) |
3 |
UK data |
|
57.002 |
Pyrgus malvae (Linnaeus, 1758) |
1673 |
|
|
57.0021 |
Pyrgus serratulae (Rambur, 1839) |
1 |
UK data |
|
57.004 |
Carterocephalus palaemon (Pallas, 1771) |
950 |
|
|
57.005 |
Thymelicus lineola (Ochsenheimer, 1808) |
854 |
|
|
57.006 |
Thymelicus sylvestris (Poda, 1761) |
1250 |
|
|
57.007 |
Thymelicus acteon (Rottemberg, 1775) |
711 |
|
|
57.008 |
Hesperia comma (Linnaeus, 1758) |
875 |
|
|
57.009 |
Ochlodes sylvanus (Esper, 1779) |
1249 |
|
|
58.001 |
Leptidea sinapis (Linnaeus, 1758) |
1763 |
Irish specimens not dissected. Recently split into two species the collection has yet to be reidentified. |
|
58.002 |
Leptidea juvernica Williams, 1946 |
4 |
|
|
58.003 |
Anthocharis cardamines (Linnaeus, 1758) |
2866 |
|
|
58.005 |
Aporia crataegi (Linnaeus, 1758) |
451 |
|
|
58.006 |
Pieris brassicae (Linnaeus, 1758) |
2281 |
|
|
58.007 |
Pieris rapae (Linnaeus, 1758) |
2413 |
|
|
58.008 |
Pieris napi (Linnaeus, 1758) |
8164 |
|
|
58.009 |
Pontia daplidice (Linnaeus, 1758) |
160 |
|
|
58.01 |
Colias croceus (Fourcroy, 1785) |
2749 |
|
|
58.011 |
Colias hyale (Linnaeus, 1758) |
662 |
|
|
58.012 |
Colias alfacariensis Berger, 1948 |
65 |
|
|
58.0121 |
Colias phicomone (Esper, 1780) |
1 |
UK data |
|
58.013 |
Gonepteryx rhamni (Linnaeus, 1758) |
884 |
|
|
58.014 |
Gonepteryx cleopatra (Linnaeus, 1767) |
4 |
4 UK data |
|
59.001 |
Danaus plexippus (Linnaeus, 1758) |
24 |
|
|
59.002 |
Lasiommata megera (Linnaeus, 1767) |
1907 |
|
|
59.003 |
Pararge aegeria (Linnaeus, 1758) |
3037 |
|
|
59.004 |
Coenonympha tullia (Müller, 1764) |
5293 |
|
|
59.005 |
Coenonympha pamphilus (Linnaeus, 1758) |
4008 |
|
|
59.006 |
Erebia ligea (Linnaeus, 1758) |
5 |
3 UK data, 2 No data |
|
59.007 |
Erebia epiphron (Knoch, 1783) |
1422 |
|
|
59.008 |
Erebia aethiops (Esper, 1777) |
1734 |
|
|
59.009 |
Aphantopus hyperantus (Linnaeus, 1758) |
3686 |
|
|
59.01 |
Maniola jurtina (Linnaeus, 1758) |
7118 |
|
|
59.011 |
Pyronia tithonus (Linnaeus, 1771) |
3016 |
|
|
59.012 |
Melanargia galathea (Linnaeus, 1758) |
2706 |
|
|
59.013 |
Hipparchia semele (Linnaeus, 1758) |
2878 |
|
|
59.0131 |
Hipparchia fagi (Scopoli, 1763) |
1 |
UK data |
|
59.0132 |
Arethusana arethusa ([Denis & Schiffermüller], 1775) |
1 |
UK data |
|
59.0137 |
Dryas julia (Fabricius, 1775) |
1 |
UK data |
|
59.0138 |
Heliconius charithonia (Linnaeus, 1767) |
1 |
UK data |
|
59.014 |
Boloria euphrosyne (Linnaeus, 1758) |
2697 |
|
|
59.015 |
Boloria selene ([Denis & Schiffermüller], 1775) |
3097 |
|
|
59.0151 |
Boloria dia (Linnaeus,1767) |
1 |
No data |
|
59.016 |
Issoria lathonia (Linnaeus, 1758) |
119 |
|
|
59.017 |
Argynnis paphia (Linnaeus, 1758) |
2164 |
|
|
59.019 |
Argynnis aglaja (Linnaeus, 1758) |
1882 |
|
|
59.02 |
Argynnis adippe ([Denis & Schiffermüller], 1775) |
1463 |
|
|
59.0201 |
Argynnis niobe (Linnaeus, 1758) |
4 |
3 UK, 1 no data; Agassiz number B36 |
|
59.021 |
Limenitis camilla (Linnaeus, 1764) |
1169 |
|
|
59.022 |
Apatura iris (Linnaeus, 1758) |
566 |
|
|
59.0221 |
Colobura dirce (Linnaeus, 1758) |
1 |
UK data |
|
59.0221 |
Parthenos sylvia (Cramer, 1775) |
1 |
UK data |
|
59.023 |
Vanessa atalanta (Linnaeus, 1758) |
1268 |
|
|
59.024 |
Vanessa cardui (Linnaeus, 1758) |
957 |
|
|
59.025 |
Vanessa virginiensis (Drury, 1773) |
2 |
|
|
59.0251 |
Vanessa indica (Herbst, 1794) |
1 |
UK data |
|
59.0252 |
Hypanartia lethe (Fabricius 1793) |
1 |
UK data |
|
59.026 |
Aglais io (Linnaeus, 1758) |
1280 |
|
|
59.027 |
Aglais urticae (Linnaeus, 1758) |
3604 |
|
|
59.028 |
Nymphalis antiopa (Linnaeus, 1758) |
134 |
|
|
59.029 |
Nymphalis polychloros (Linnaeus, 1758) |
776 |
|
|
59.03 |
Nymphalis xanthomelas (Esper, 1781) |
1 |
|
|
59.031 |
Polygonia c-album (Linnaeus, 1758) |
2044 |
|
|
59.032 |
Araschnia levana (Linnaeus, 1758) |
10 |
UK data |
|
59.0321 |
Junonia oenone (Linnaeus, 1758) |
1 |
UK data |
|
59.033 |
Euphydryas aurinia (Rottemberg, 1775) |
6423 |
|
|
59.034 |
Melitaea cinxia (Linnaeus, 1758) |
1870 |
|
|
59.036 |
Melitaea athalia (Rottemberg, 1775) |
2253 |
|
|
60.001 |
Hamearis lucina (Linnaeus, 1758) |
1710 |
|
|
61.001 |
Lycaena phlaeas (Linnaeus, 1761) |
5996 |
|
|
61.002 |
Lycaena dispar (Haworth, 1802) |
1098 |
345 UK |
|
61.0021 |
Lycaena hippothoe (Linnaeus, 1761) |
7 |
6 No data, 1 UK data; Agassiz number B40 |
|
61.0022 |
Lycaena virgaureae (Linnaeus, 1758) |
8 |
3 UK, 5 no data; Agassiz number B39 |
|
61.003 |
Thecla betulae (Linnaeus, 1758) |
1199 |
|
|
61.004 |
Favonius quercus (Linnaeus, 1758) |
1197 |
|
|
61.005 |
Callophrys rubi (Linnaeus, 1758) |
1425 |
|
|
61.006 |
Satyrium w-album (Knoch, 1782) |
990 |
|
|
61.007 |
Satyrium pruni (Linnaeus, 1758) |
893 |
|
|
61.0071 |
Deudorix antalus (Hopffer, 1855) |
1 |
UK data, (2 specimens in original list) |
|
61.0071 |
Rapala schistacea (Moore, 1881) |
2 |
UK data |
|
61.008 |
Lampides boeticus (Linnaeus, 1767) |
34 |
|
|
61.0081 |
Cacyreus marshalli Butler, 1898 |
3 |
|
|
61.01 |
Cupido minimus (Fuessly, 1775) |
1937 |
|
|
61.011 |
Cupido argiades (Pallas, 1771) |
4 |
2 No data, 2 UK |
|
61.012 |
Celastrina argiolus (Linnaeus, 1758) |
2298 |
|
|
61.013 |
Maculinea arion (Linnaeus, 1758) |
1827 |
|
|
61.01305 |
Maculinea alcon ([Denis & Schiffermüller], 1775) |
1 |
UK data |
|
61.0131 |
Glaucopsyche alexis (Poda, 1761) |
2 |
1 UK data, 1 No data |
|
61.014 |
Plebejus argus (Linnaeus, 1758) |
9094 |
|
|
61.0141 |
Aricia Reichenbach, 1817 |
124 |
No locality data hence specimens could not be assigned to either A. agestis or A. artaxerxes |
|
61.015 |
Aricia agestis ([Denis & Schiffermüller], 1775) |
2512 |
|
|
61.016 |
Aricia artaxerxes (Fabricius, 1793) |
1836 |
|
|
61.0161 |
Aricia agestis × artaxerxes |
1637 |
Bred hybrids |
|
61.017 |
Cyaniris semiargus (Rottemberg, 1775) |
229 |
|
|
61.018 |
Polyommatus icarus (Rottemberg, 1775) |
12495 |
|
|
61.0181 |
Polyommatus dorylas ([Denis & Schiffermüller], 1775) |
2 |
2 UK data; Agassiz number B43 |
|
61.019 |
Lysandra bellargus (Rottemberg, 1775) |
8592 |
|
|
61.02 |
Lysandra coridon (Poda, 1761) |
21702 |
|
|
61.0201 |
Lysandra coridon × bellargus |
3 |
Naturally occurring hybrids |
The British and Irish butterfly collections was built up over many years through the purchase of smaller collections and individual collecting.
Temporal coverage
The NHMUK British and Irish collections span nearly two centuries. The collecting of butterflies became a popular pastime for amateur and professional collectors alike with the main period of collecting spanning the turn of the 20th century until the mid 1950s (Fig.
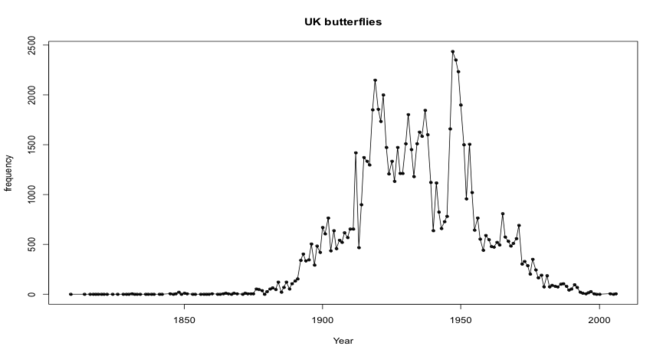
Fig.
Collection data
Usage rights
Data resources
Specimen data of British and Irish butterflies giving identification (including aberrations and forms), locality, collector and date of collector (where known).
| Column label | Column description |
|---|---|
| GBIF | GBIF quality status |
| Catalogue | NHMUK catalogue number |
| Scientific name | Genus and species name |
| Author | Author name and date |
| Type status | Type status |
| Locality | Geographic locality |
| Country | Country |
| Records | Collector |
| Collection | Which NHMUK collection specimen record is from |
| Class | Taxonomic class |
| Family | Lepidopteran family |
| Genus | Genus |
| Species | Species |
| Subspecies | Subspecies |
| Project | Project title |
Acknowledgements
We would like to acknowledge the support given to the project by the Watson Trust, which provided funds to allow for the recuration of the specimens while digitsation was taking place. The support and encouragement of Scientific Steering Group of the NHM is acknowledged. This project was supported by internal NHM funds.
Author contributions
The team contributed to the general text and specifically according to their specilist input into the project as outlined in Project Description section (above).
References
- Checklist of the Lepidoptera of the British Isles.Royal Entomological Society; Field Studies Council (Great Britain),London,210pp. [InEnglish].
- Natural history museum collections provide information on phenological change in British butterflies since the mid-19th century.International Journal of Biometeorology58:1749‑1758. [InEnglish]. https://doi.org/10.1007/s00484-013-0780-6
- Living with butterflies.John Barker,London,228pp.
- The Aurelian legacy: British butterflies and their collectors.University of California Press,432pp.
Supplementary material
CSV file alternative to Table 1