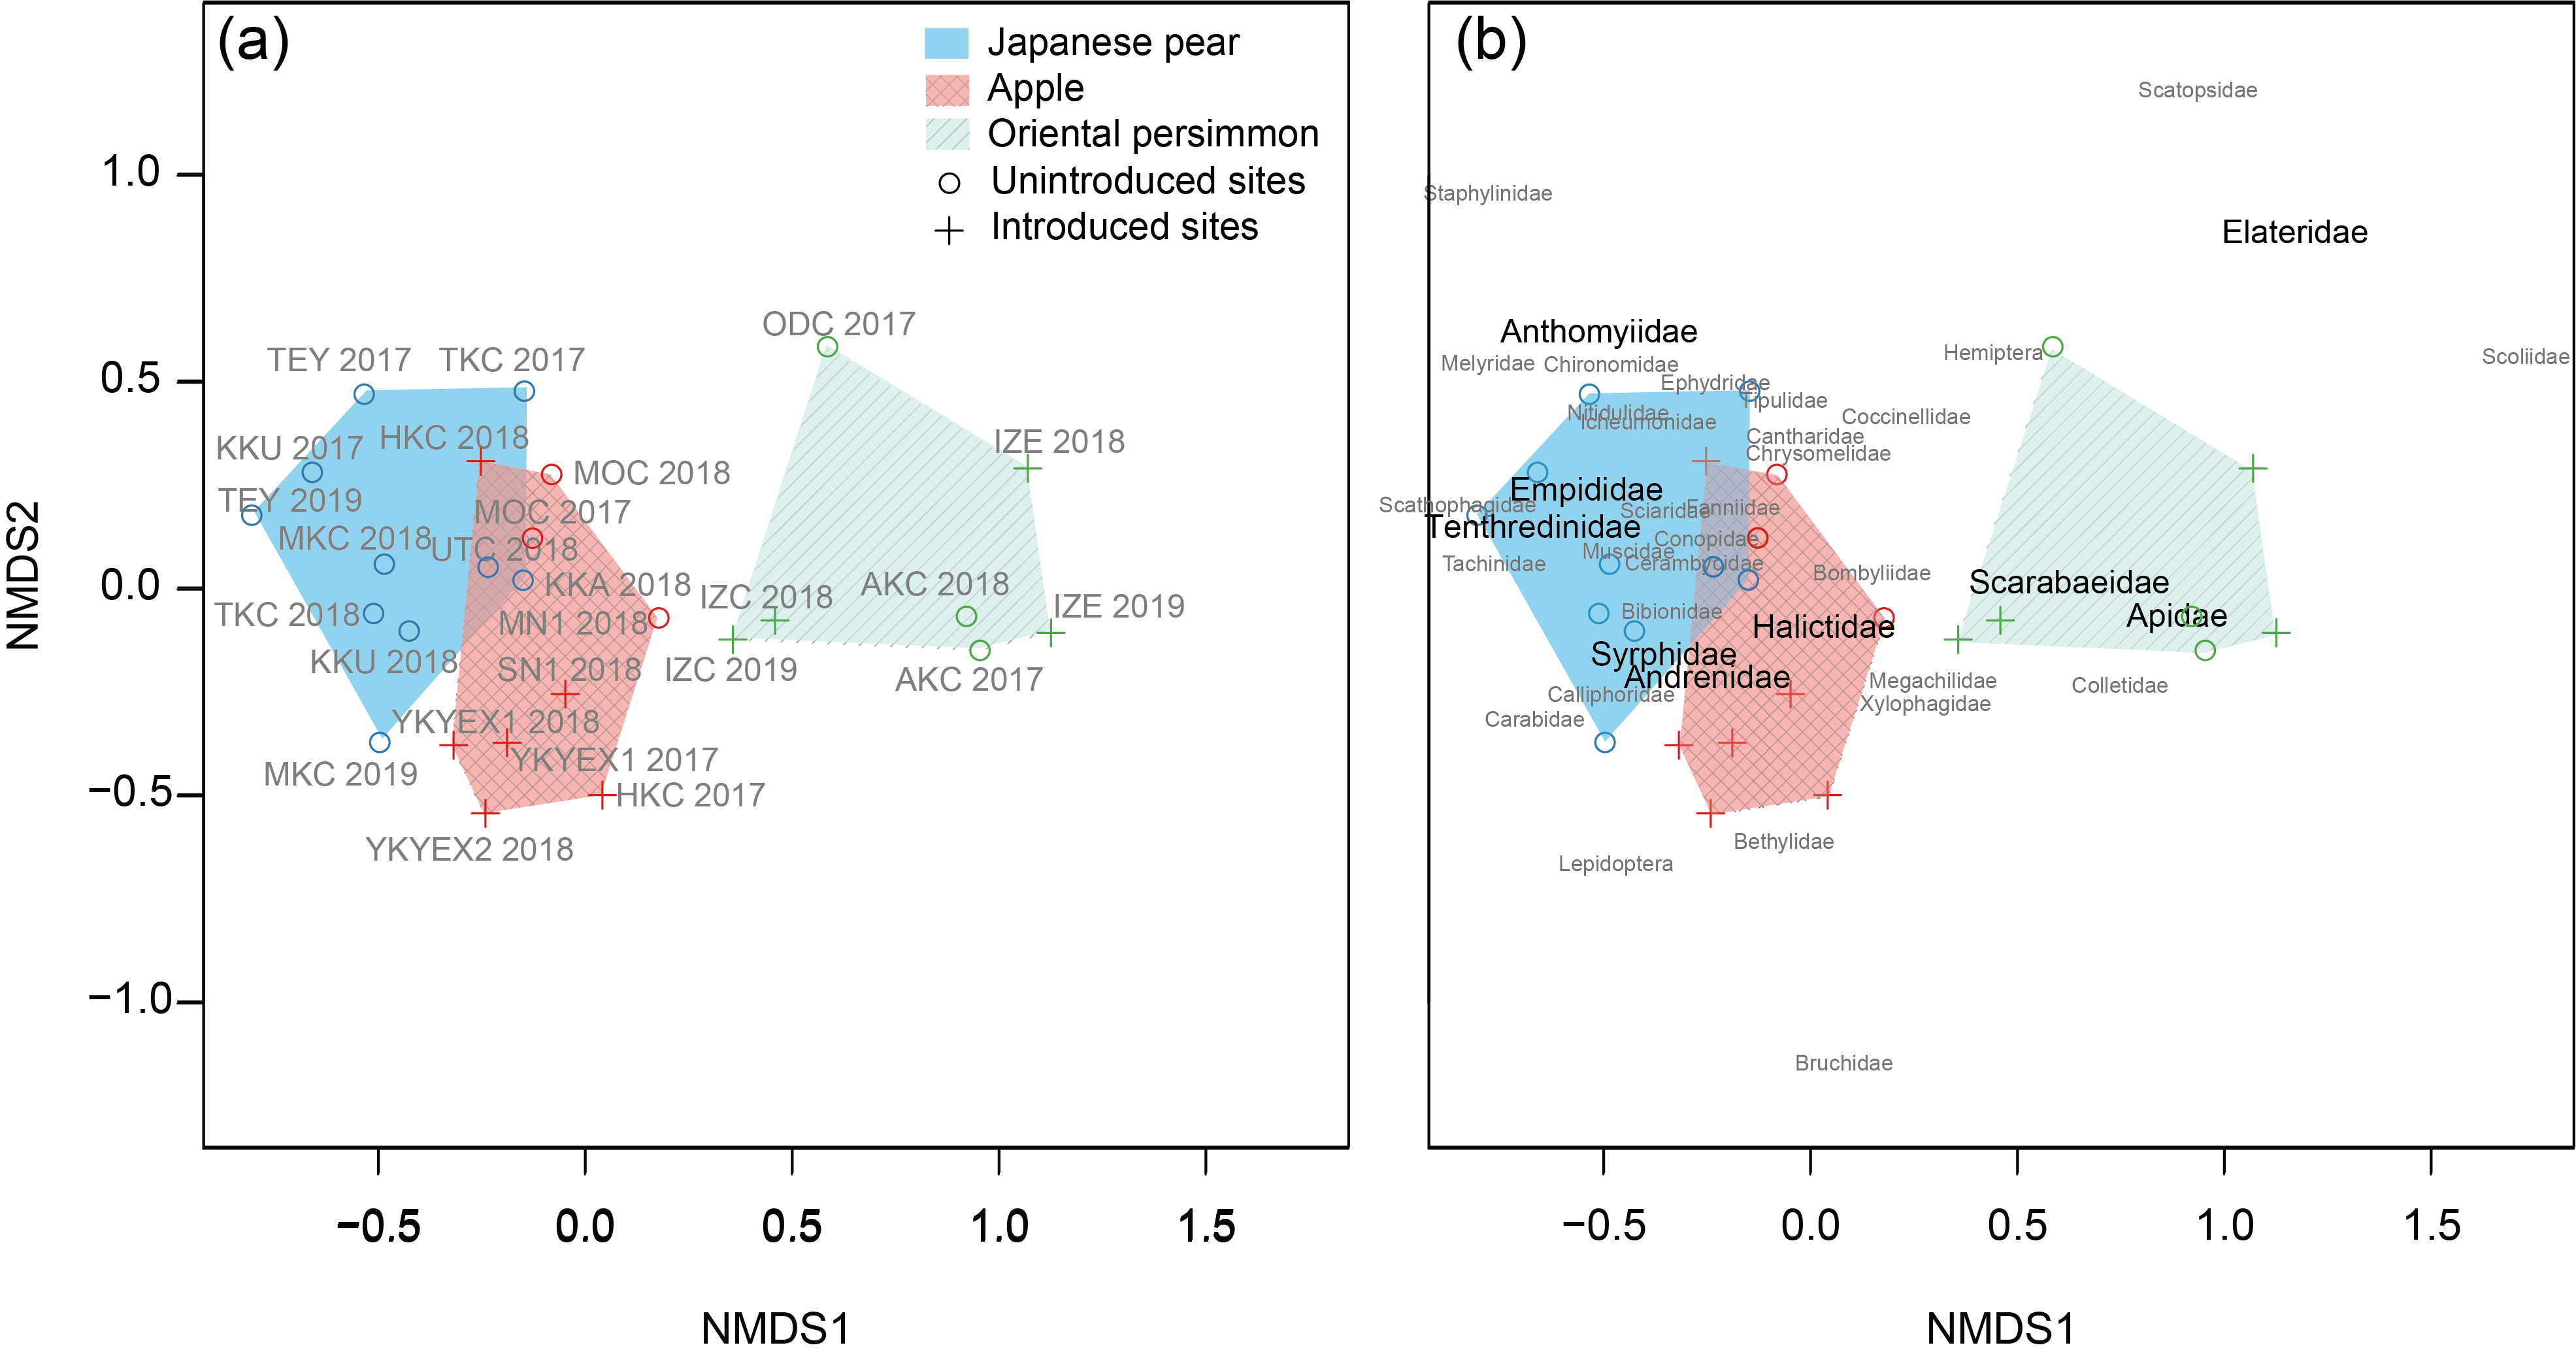
nMDS plot (a) with the names and years of the communities (information for each community is provided in Table S1: Suppl. material
Blue: Japanese pear; red: apple; green: Oriental persimmon.
|
|
||
|
nMDS plot (a) with the names and years of the communities (information for each community is provided in Table S1: Suppl. material Blue: Japanese pear; red: apple; green: Oriental persimmon. |
||
| Part of: Nakamura S, Taki H, Arai T, Funayama K, Furihata S, Furui Y, Ikeda T, Inoue H, Kagawa K, Kishimoto H, Kohyama M, Komatsu M, Konuma A, Nakada K, Nakamura S, Sawamura N, Sonoda S, Sueyoshi M, Toda S, Yaginuma K, Yamamoto S, Yoshida K, Yokoi T, Toyama M (2023) Diversity and composition of flower-visiting insects and related factors in three fruit tree species. Biodiversity Data Journal 11: e100955. https://doi.org/10.3897/BDJ.11.e100955 |