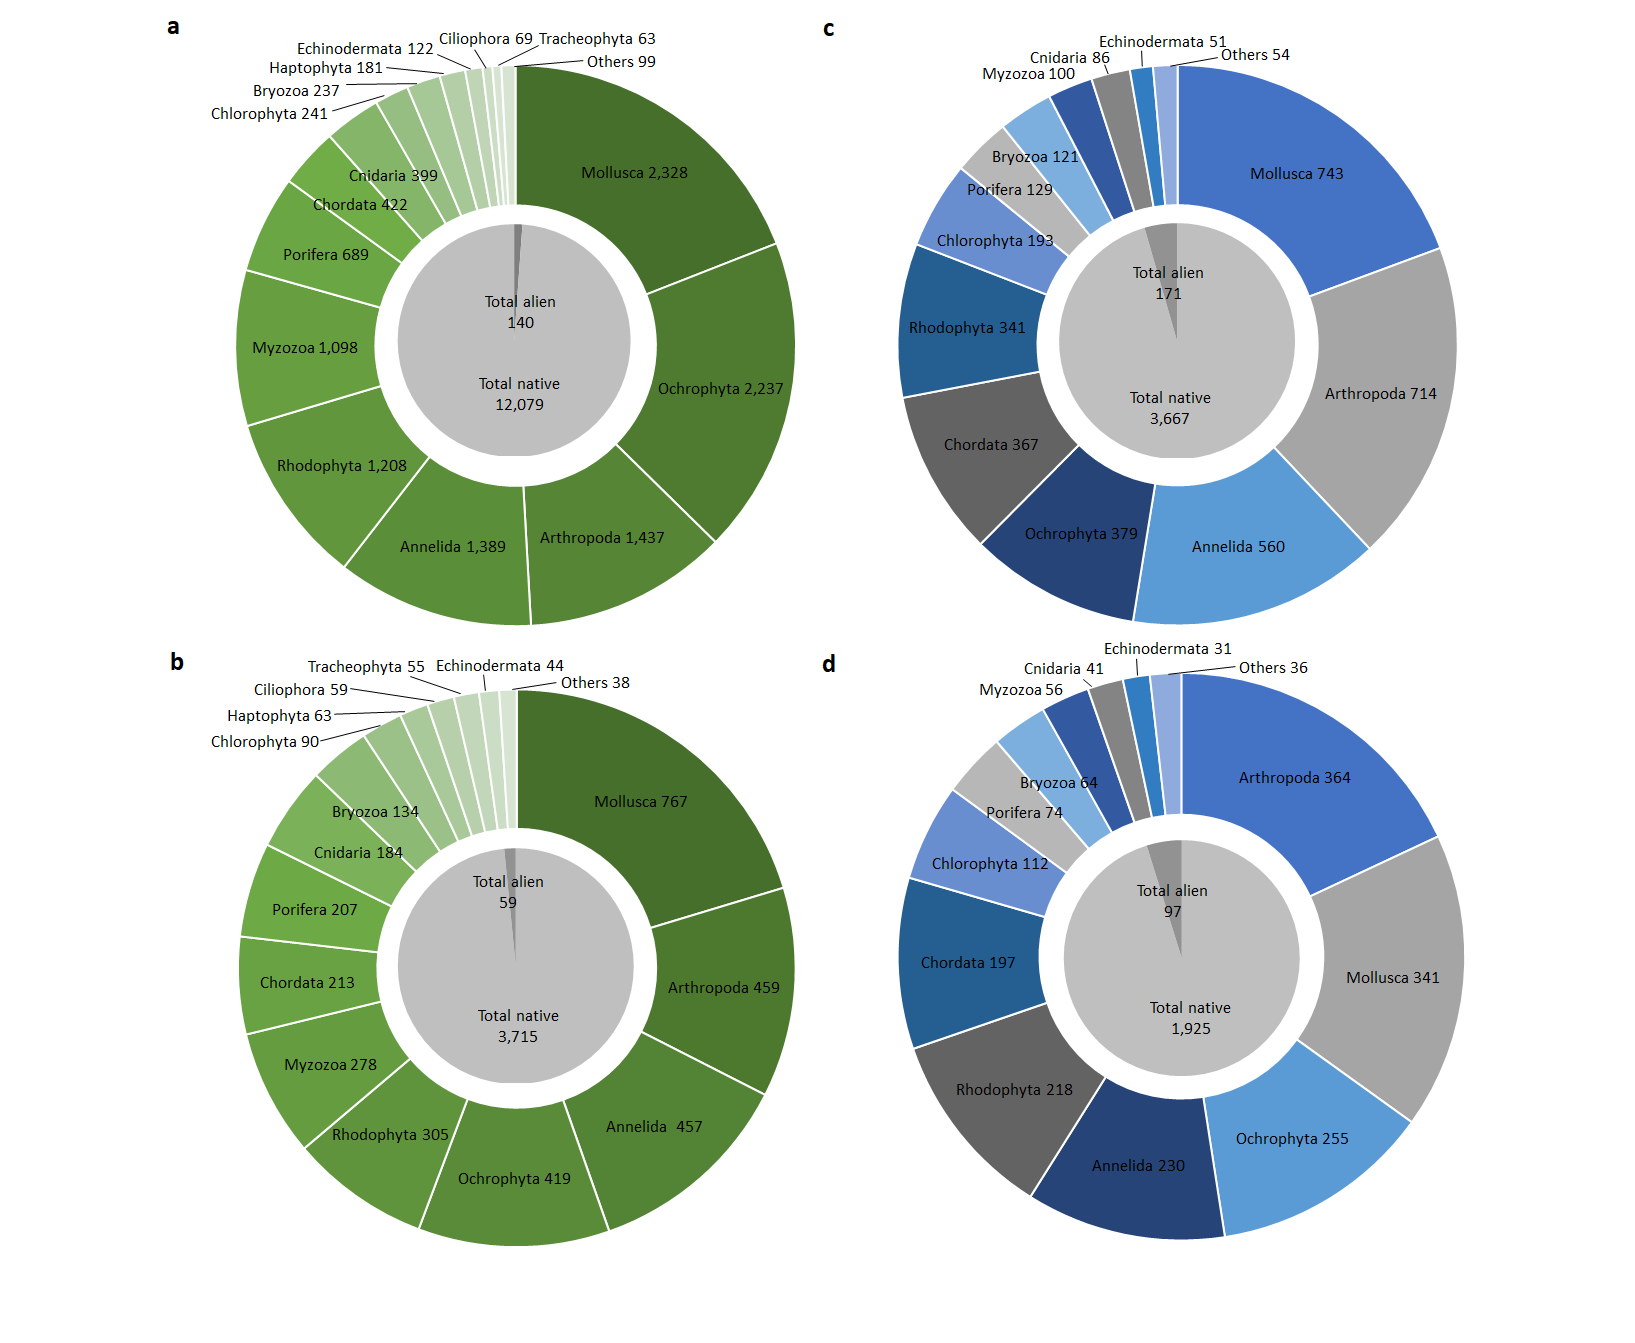
Donut charts showing the number of records (a, c) and the number of species (b, d) per phylum included in the marine (green; a, b) and transitional waters (blue; c, d) datasets. The pie charts within the donut charts represent the total number of alien and native records/species for each dataset.