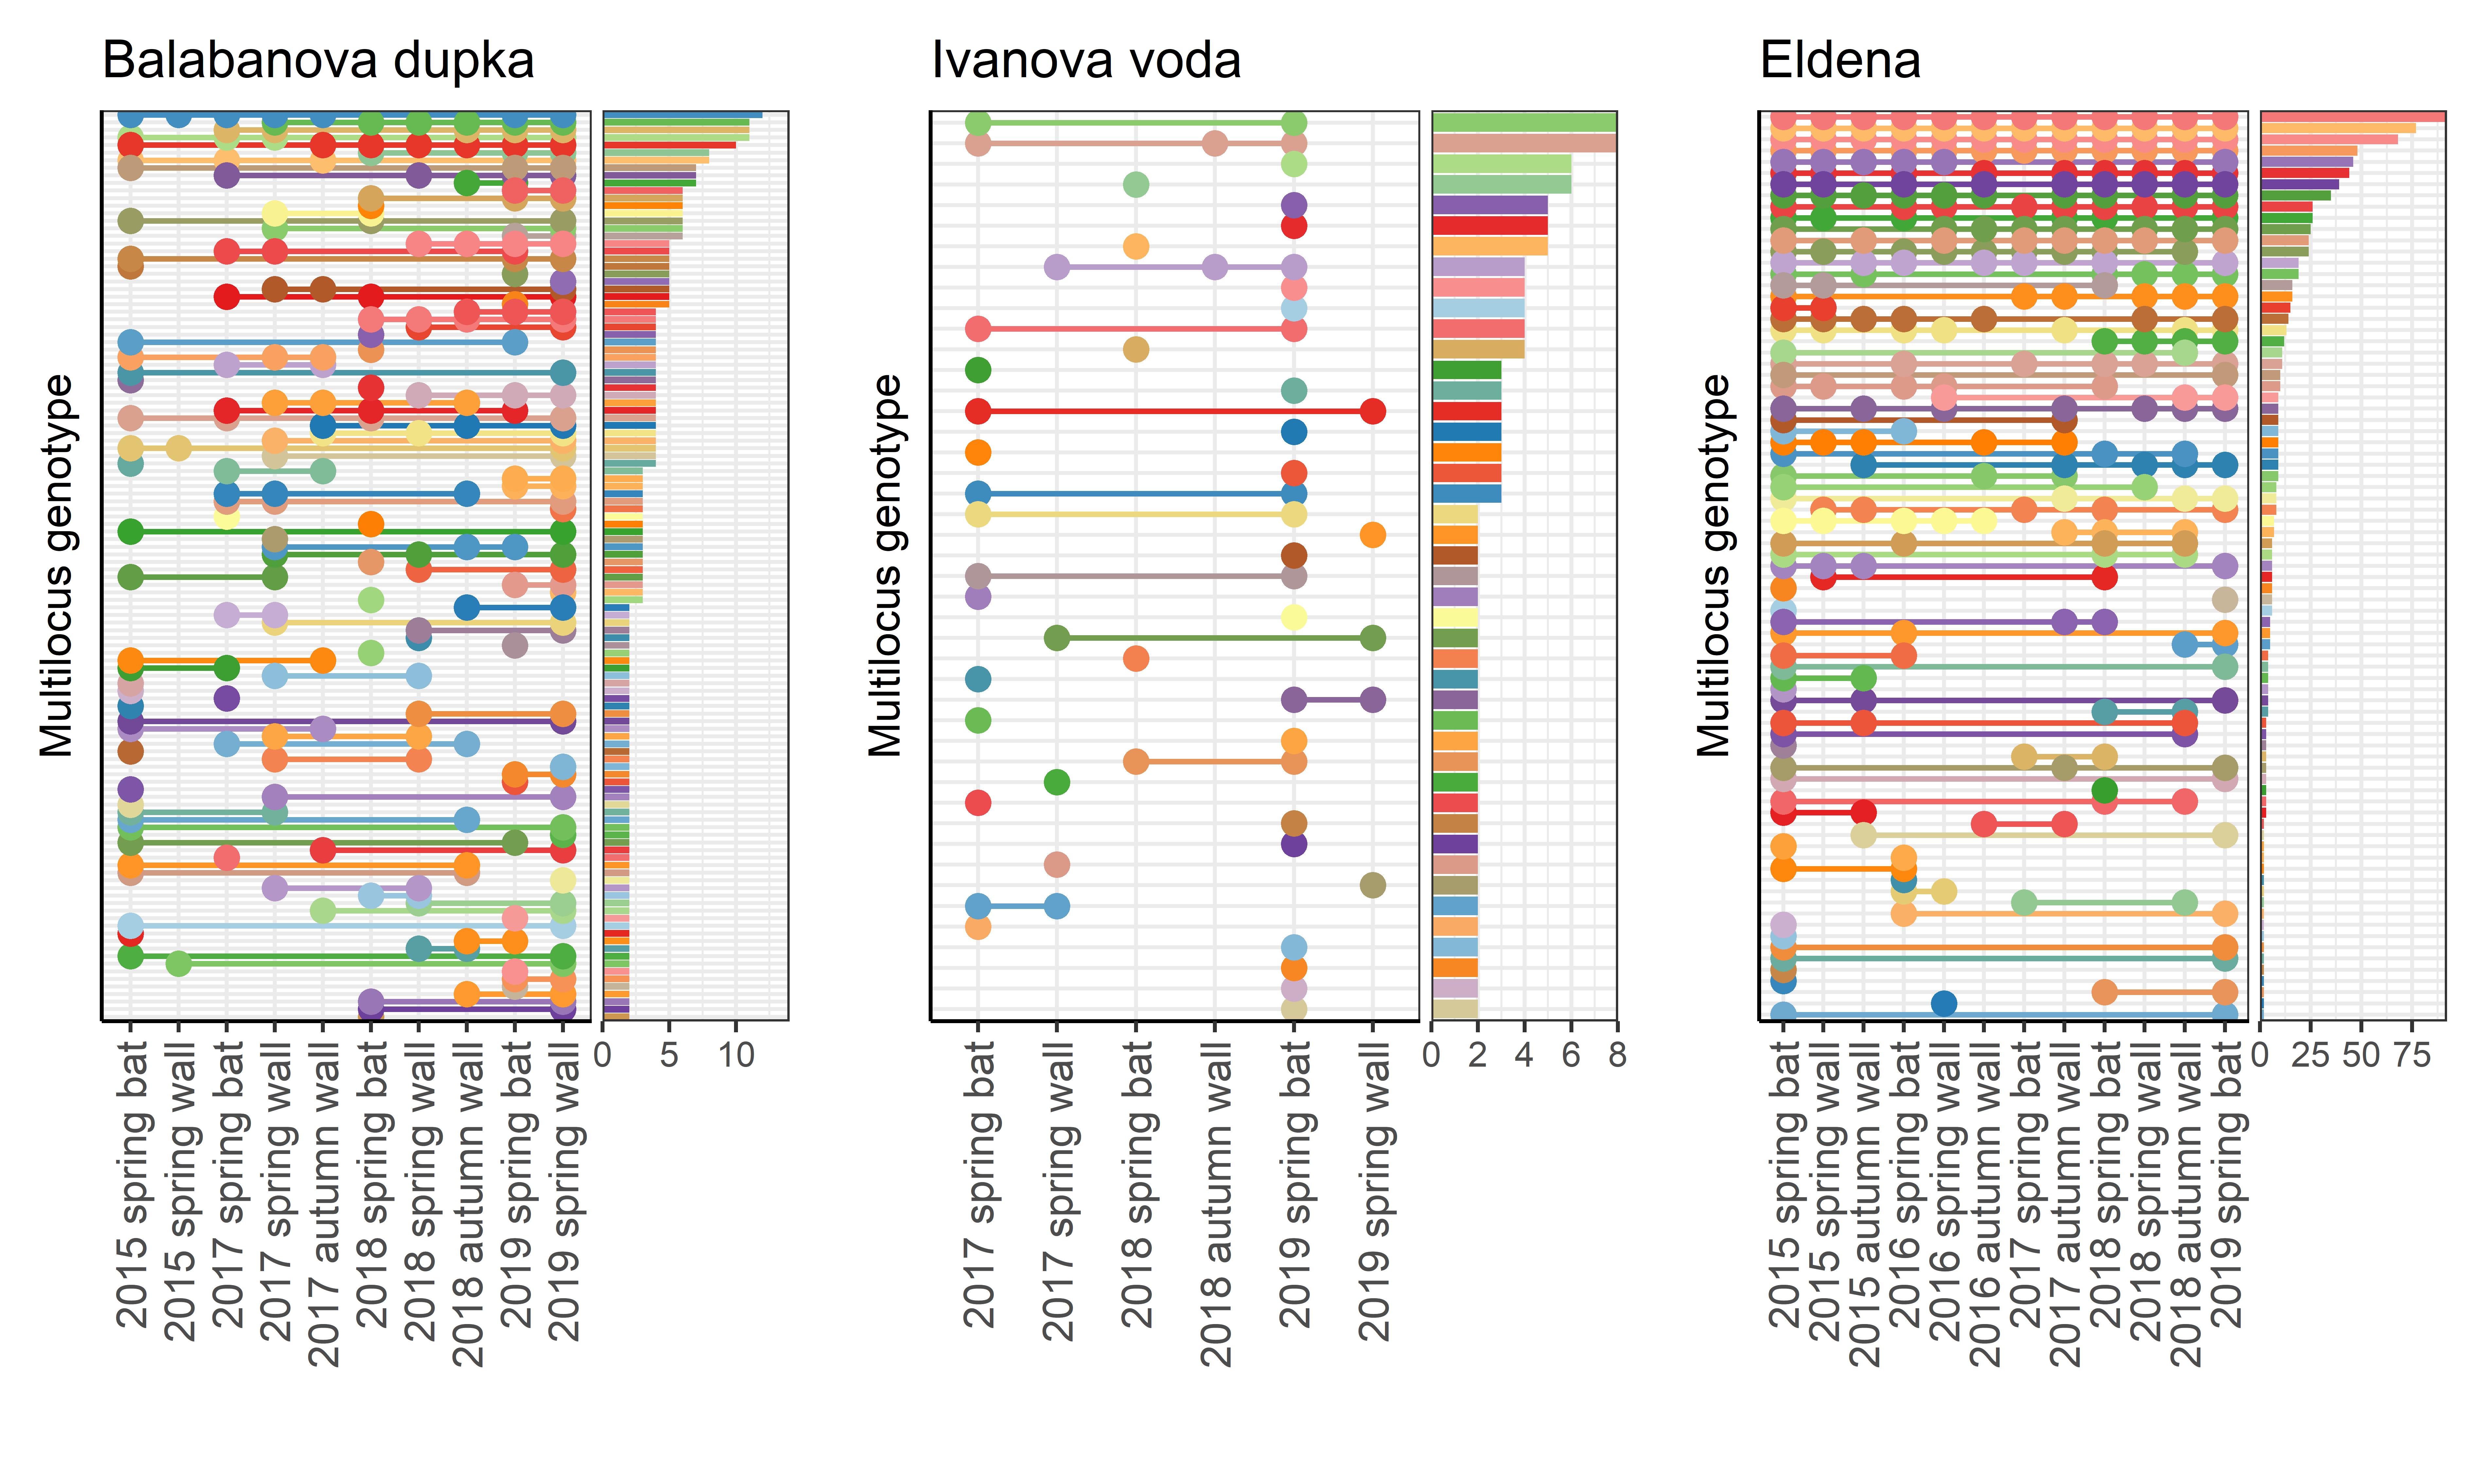
Visual representation of shared multilocus genotypes (MLGs) in the three study sites Balabanova dupka, Ivanova voda and Eldena across time and between bats and walls. Each row represents a particular MLG and a circle signifies that this MLG was detected during the particular sampling event. The bar graph represents the relative frequencies of MLG occurrence. The code used to recreate the graph was obtained from