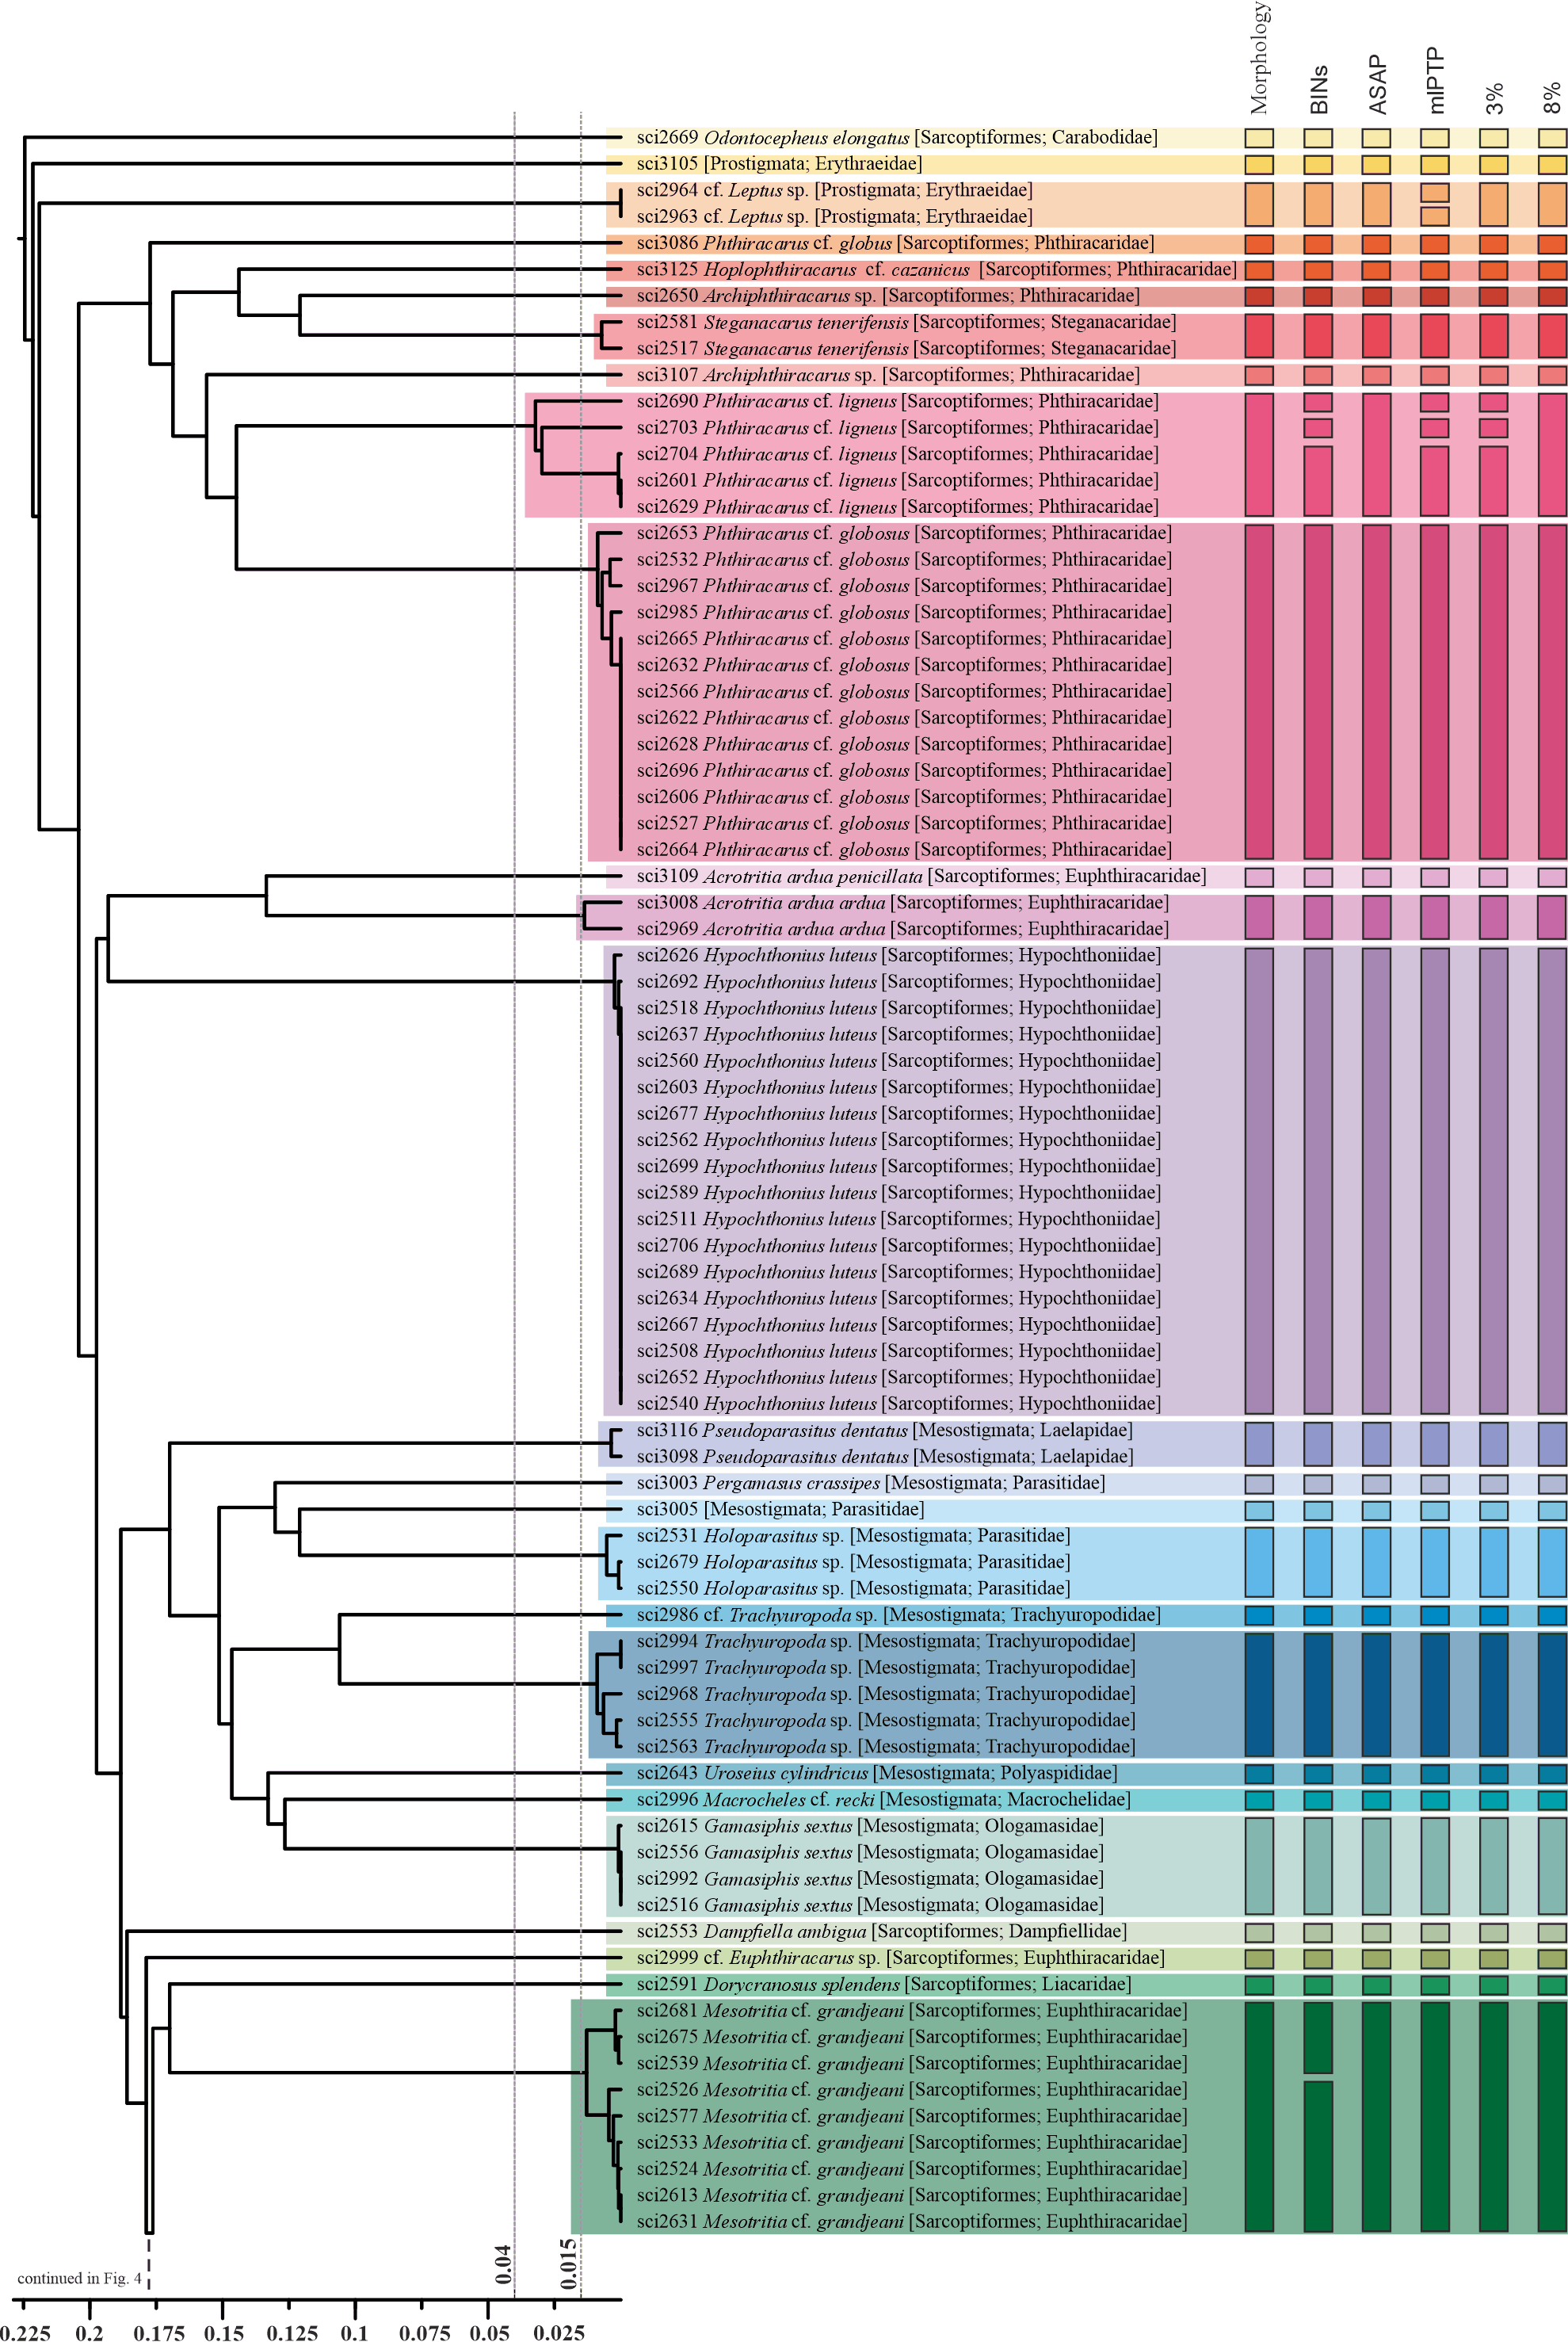
Distance-based UPGMA tree obtained using HKY corrected distances. Coloured horizontal blocks over the tree represent specimen clusters corresponding to morphological species. Vertical bars represent, from left to right: (i) morphological species, (ii) BINs classification in BOLD, (iii) species delimitation with ASAP, (iv) species delimitation with mlPTP, (v) 3% similarity clusters and (vi) 8% similarity clusters. At the bottom, each method's total number of species is presented. The X-axis represents genetic distance; with dotted lines corresponding 3% and 8% divergence thresholds (first half).