PCA and TPS analysis of the two oyster species.
The four deformation maps depicted by a thin-plate spline show the differences between the average shape and the extreme case of each PC.
|
|
||
|
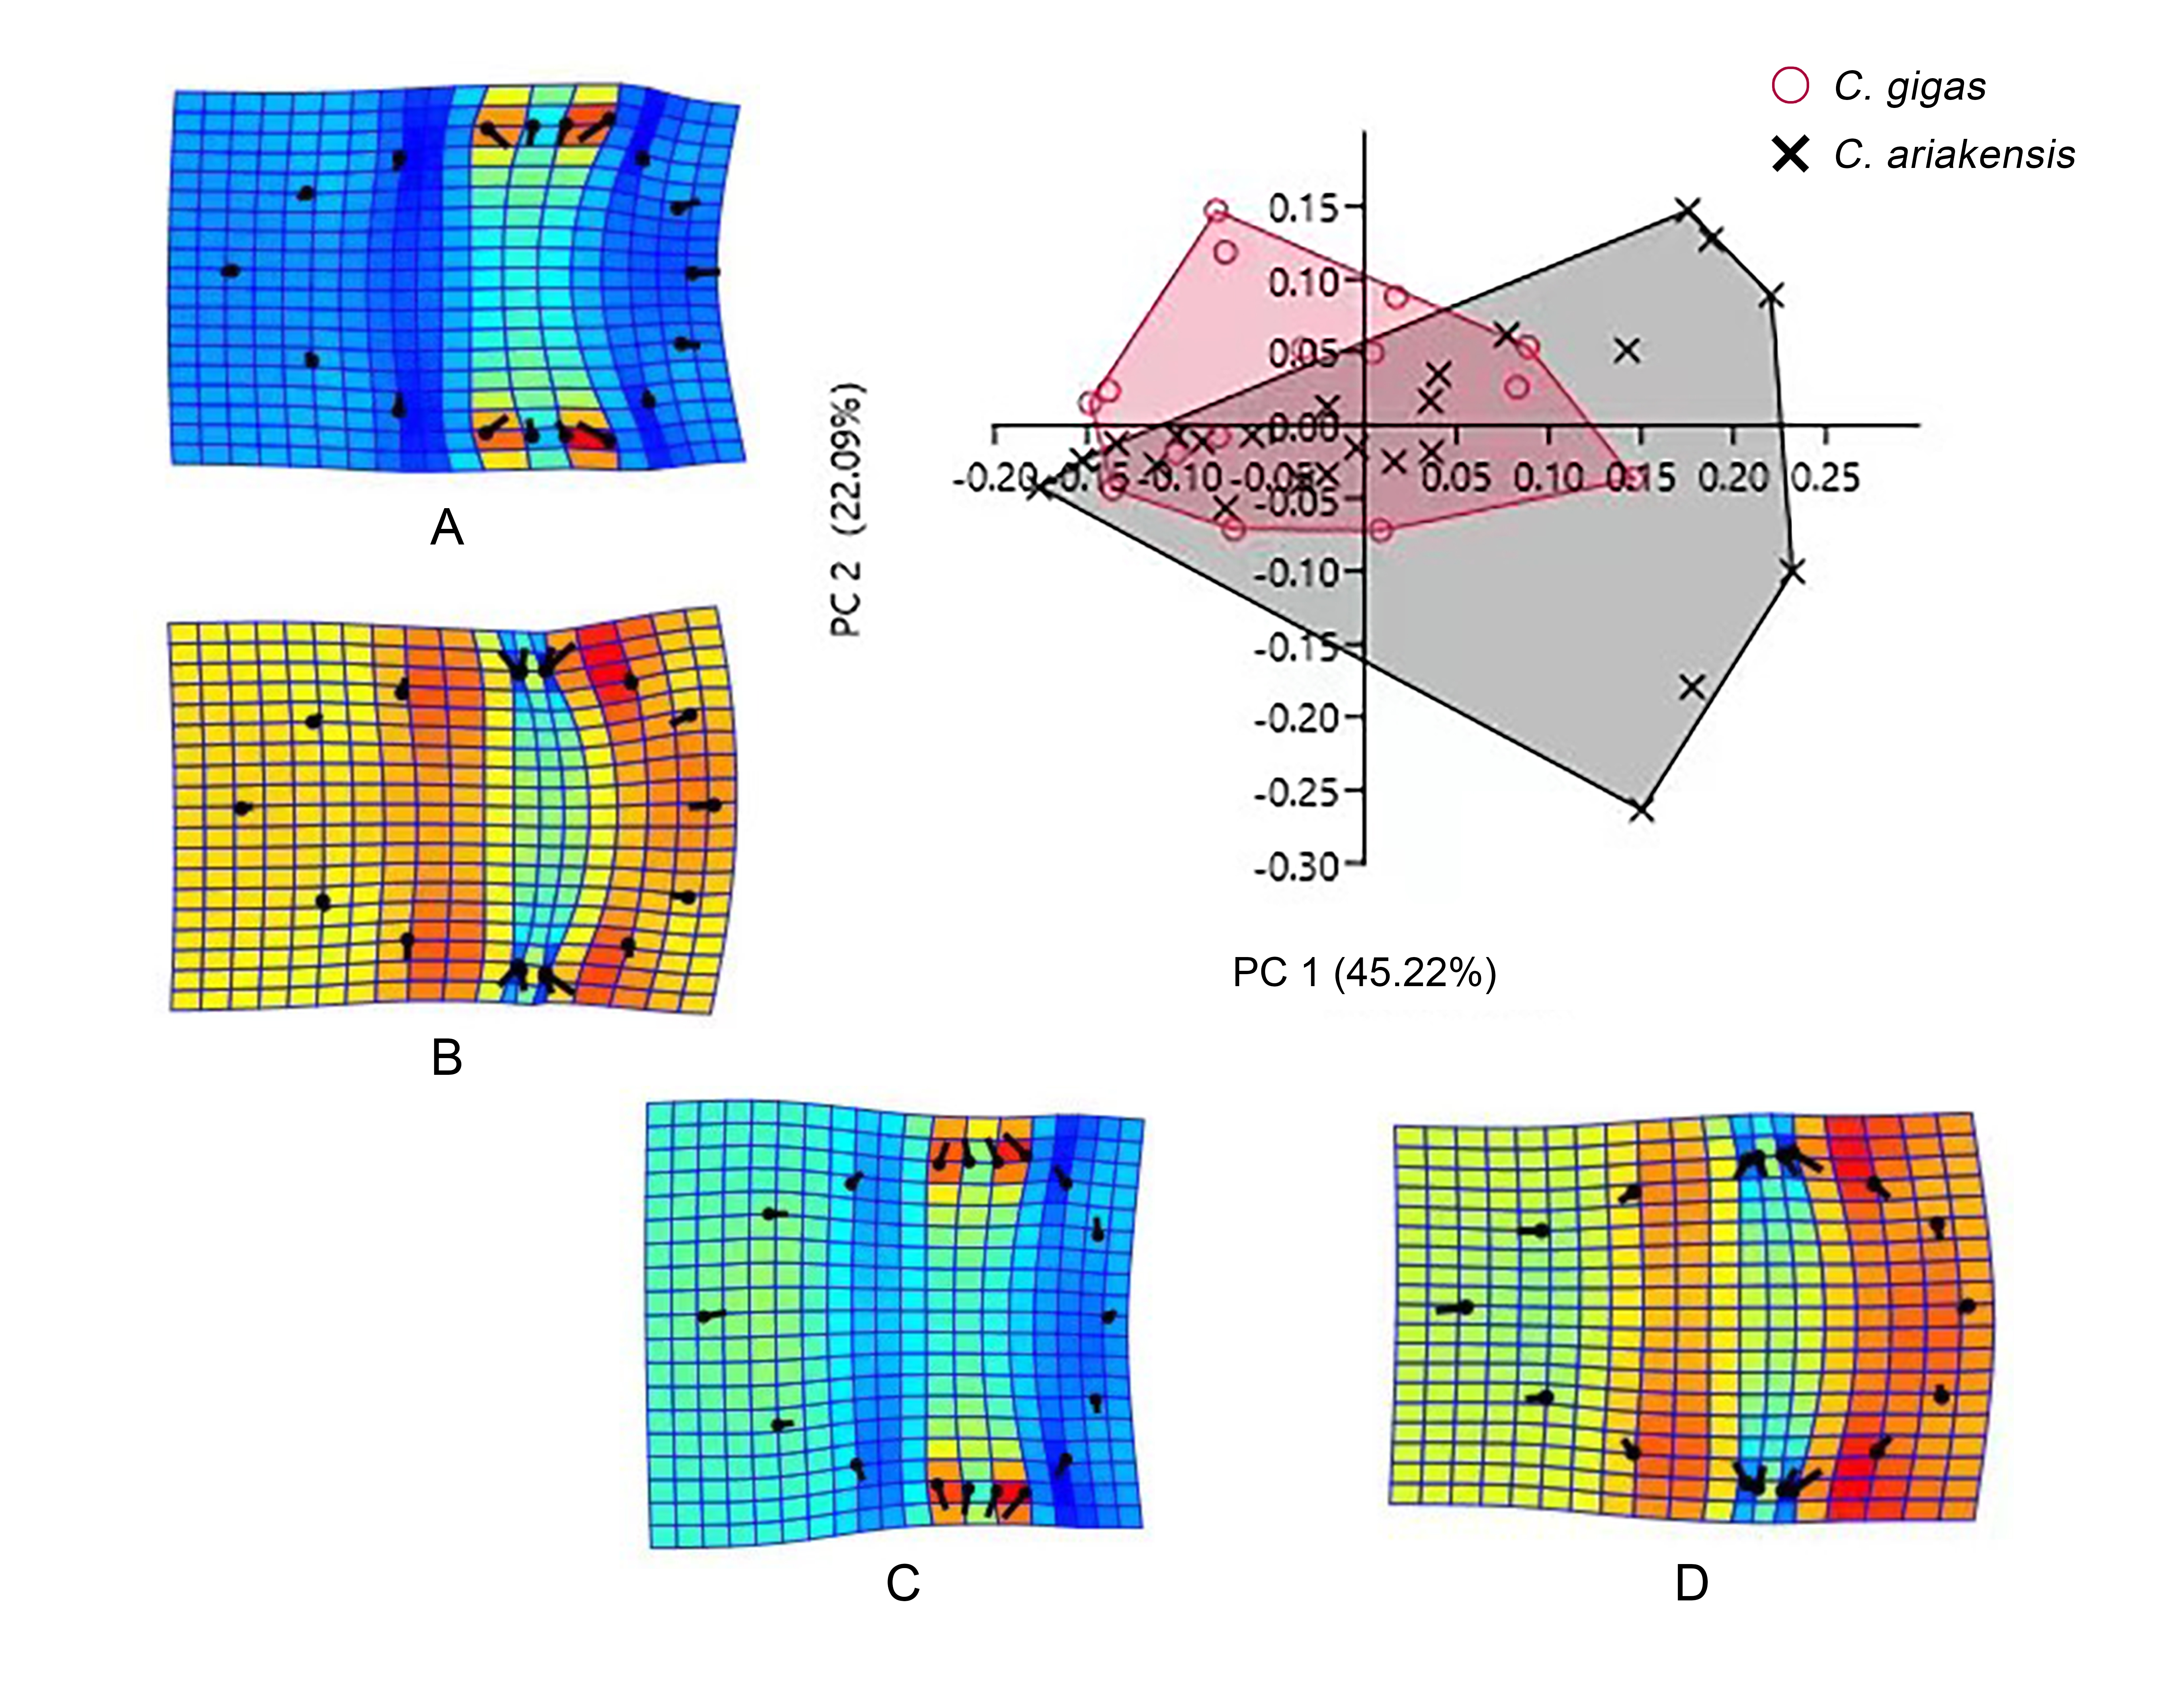
PCA and TPS analysis of the two oyster species. The four deformation maps depicted by a thin-plate spline show the differences between the average shape and the extreme case of each PC. |
||
| Part of: Liu Q, Guo Y, Yang Y, Mao J, Wang X, Liu H, Tian Y, Hao Z (2024) Geometric morphometric methods for identification of oyster species based on morphology. Biodiversity Data Journal 12: e115019. https://doi.org/10.3897/BDJ.12.e115019 |