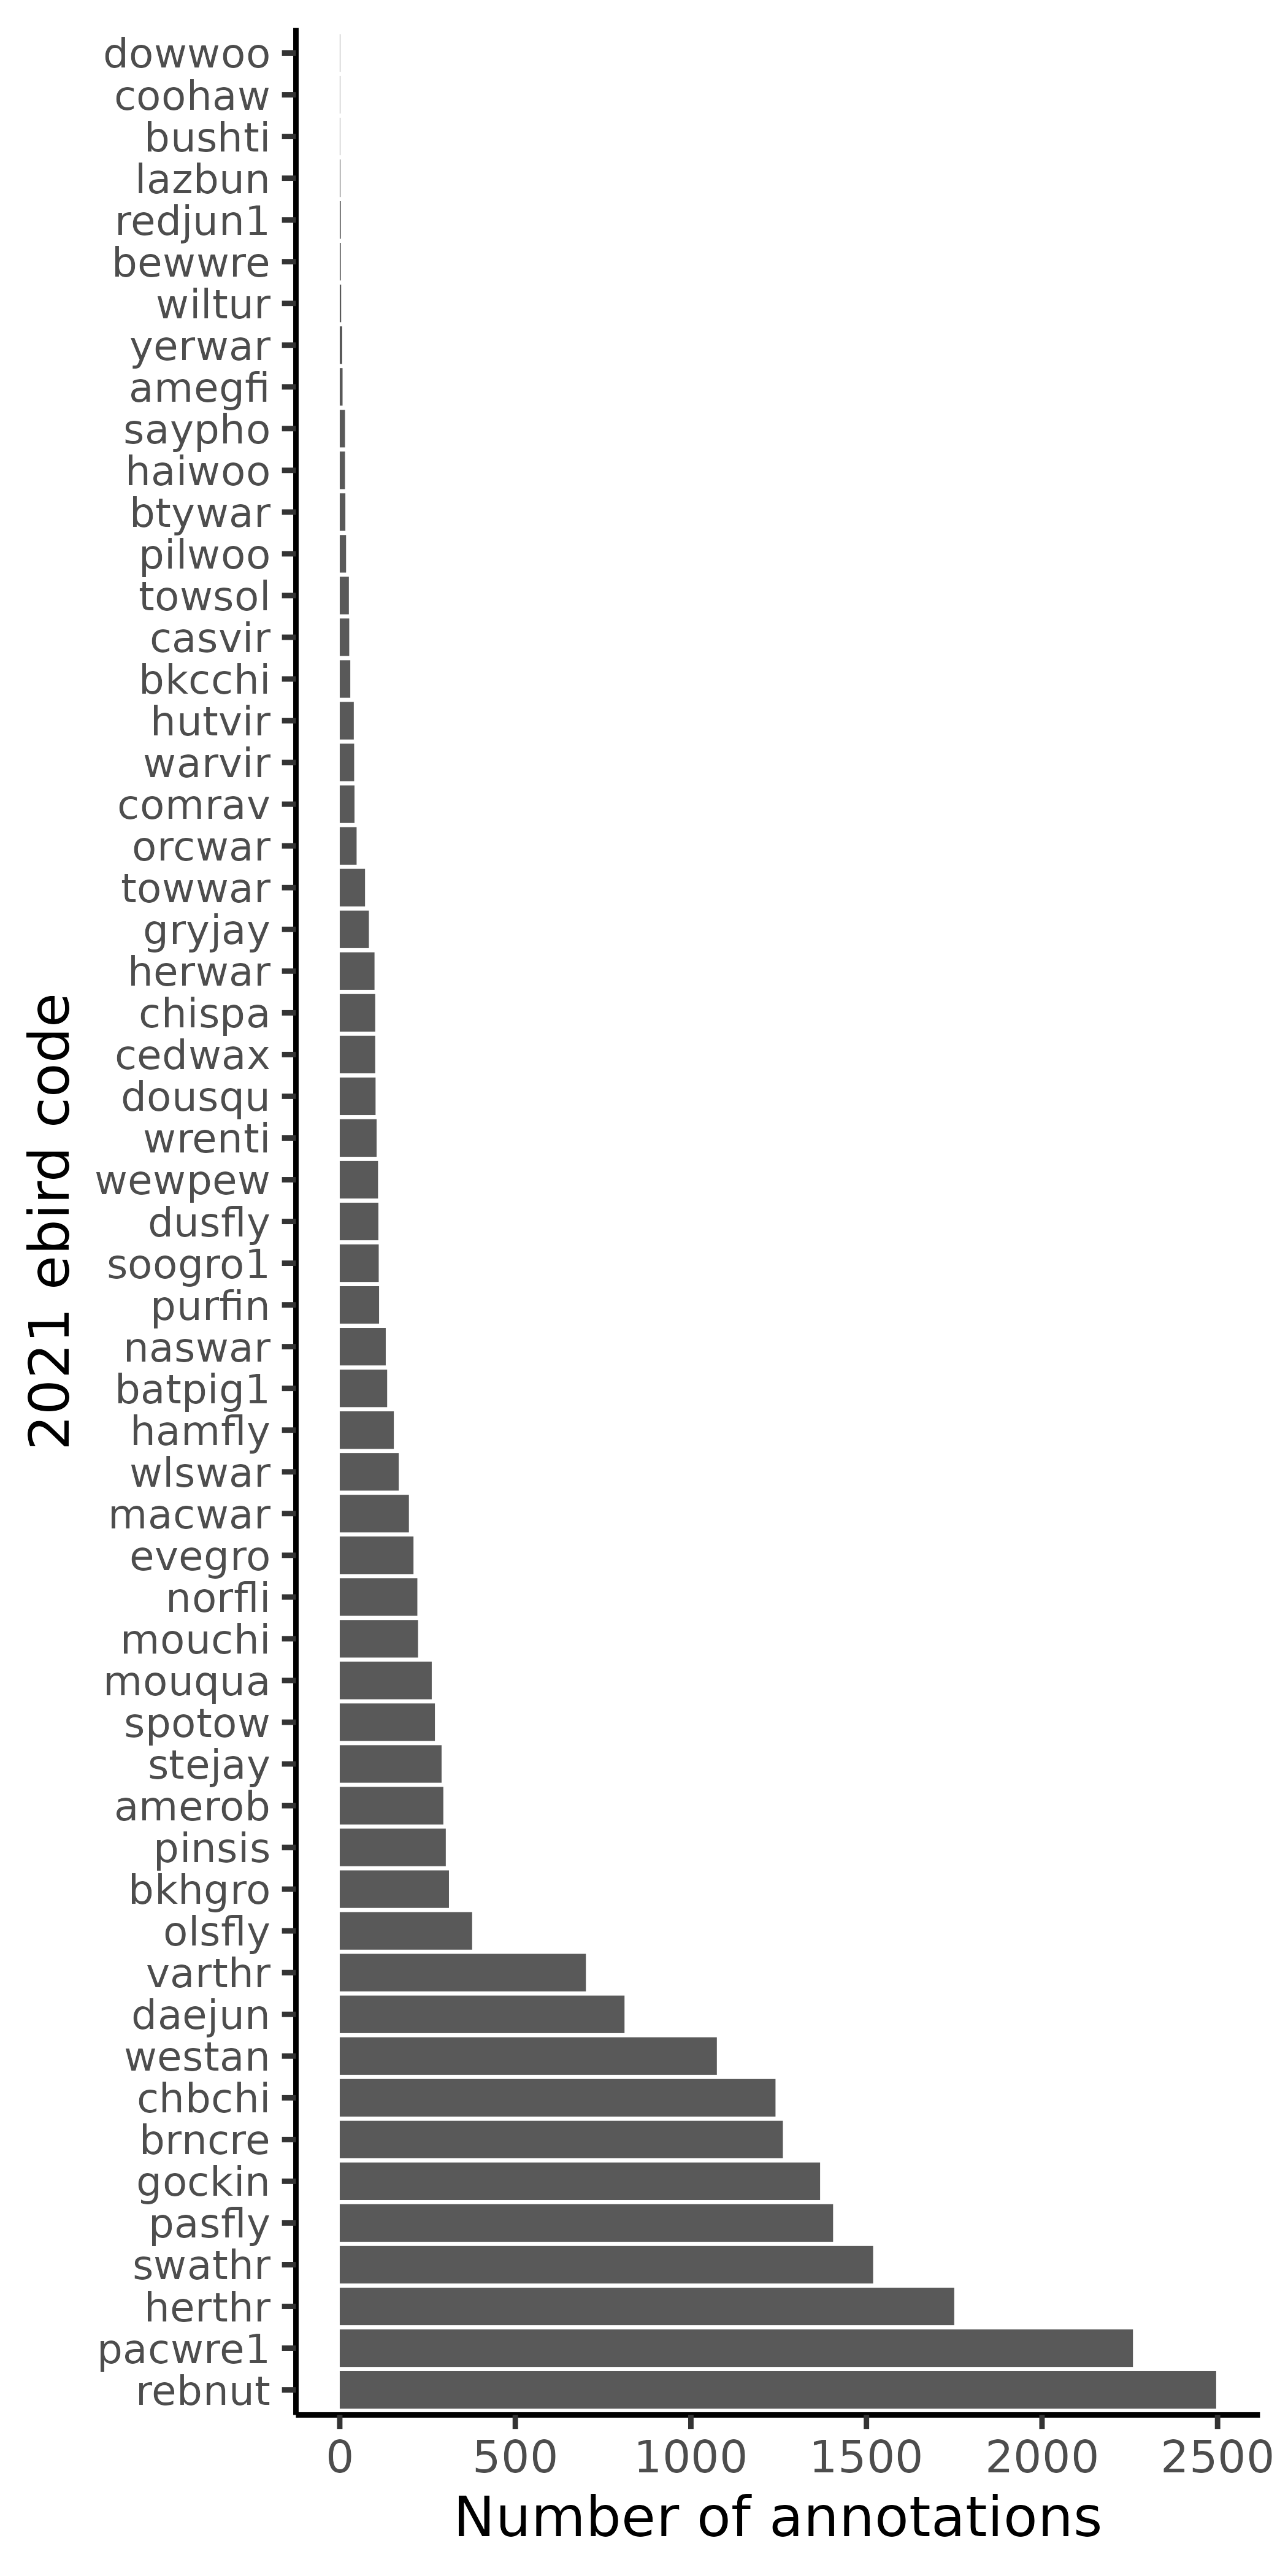
This vertical barplot visualises the frequency of annotations for the most prevalent species within the annotated dataset. The y-axis lists species by their 2021 eBird codes, ordered from most to least frequent (see Table 1 for common names). The x-axis displays the cumulative annotation count for each species. More prevalent species occur towards the bottom and have higher annotation counts. The plot reveals that a few common species dominate annotations, while many are annotated infrequently.