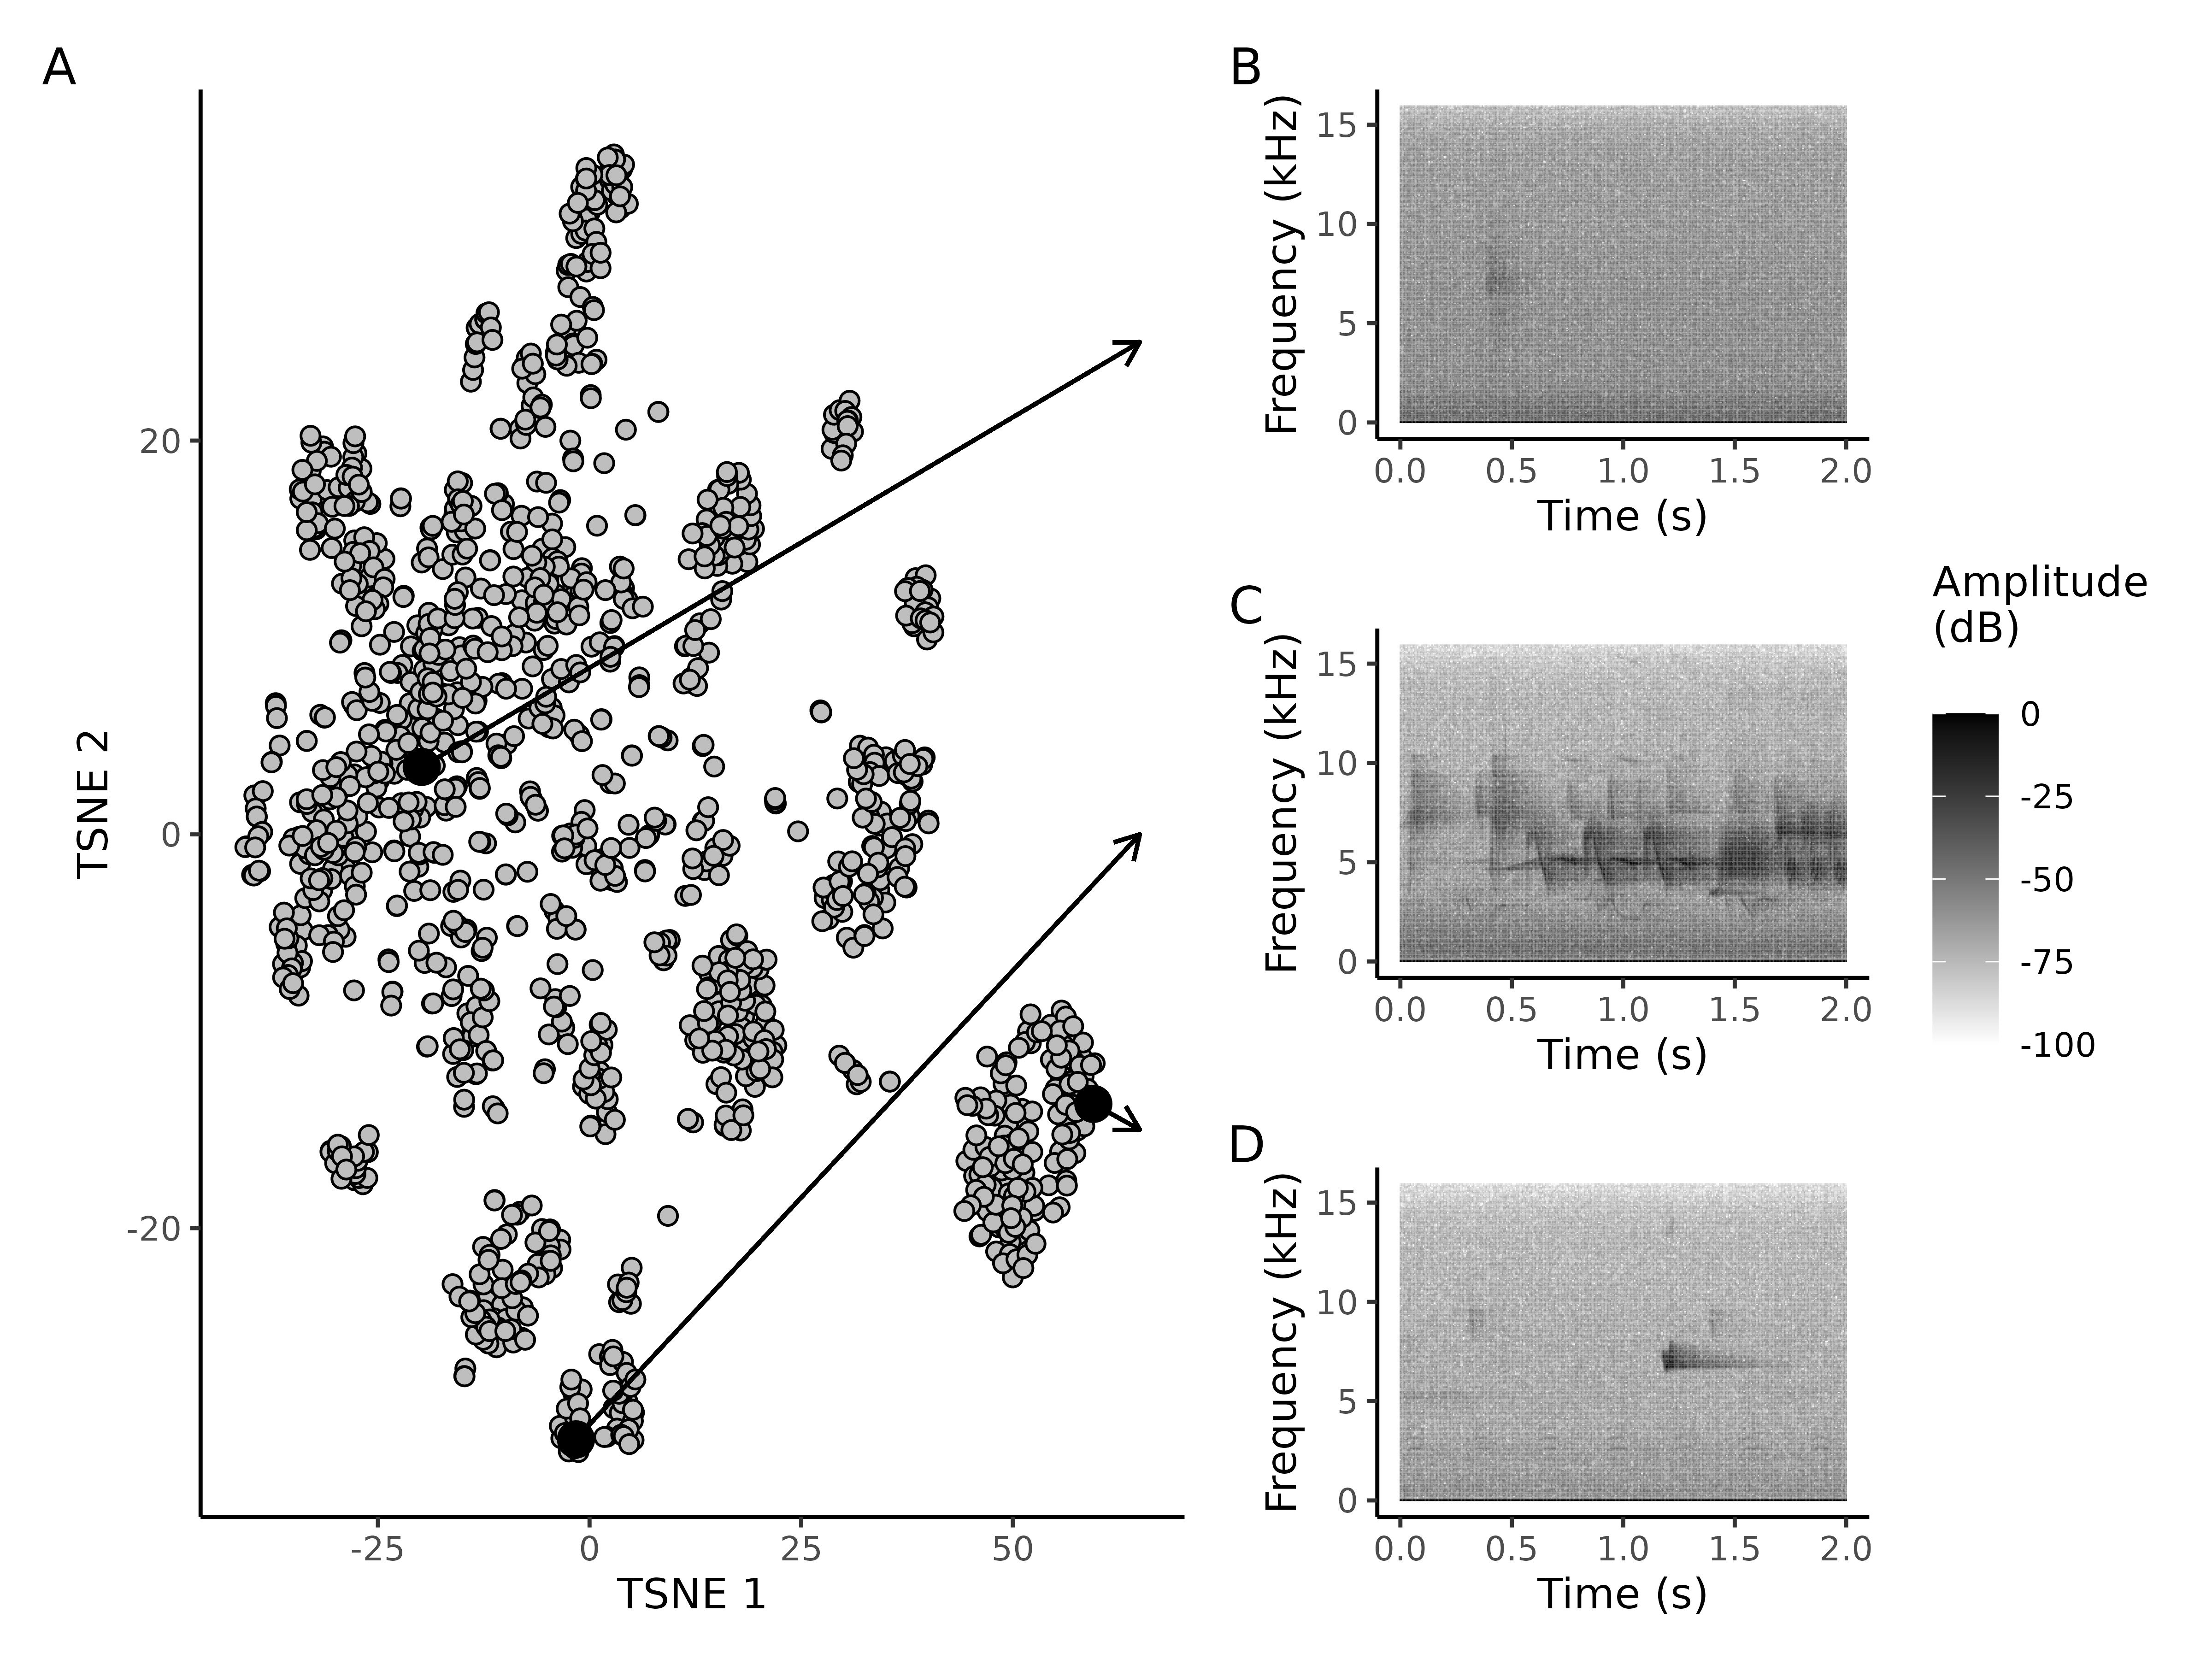
Two-dimensional t-SNE (t-distributed stochastic neighbour embedding) plots of the birdnet embeddings for the aggregated biotic unknown avian chip vocalisation class (eBird code: unk). Each data point on the plot corresponds to an individual 2-second audio clip. Panels B, C and D provide detailed spectrograms for selected audio clips marked by opaque black points on the t-SNE plot. Panel B exemplifies a typical audio clip near the centre of the primary unknown chip cluster within the t-SNE plot. Many audio clips in this cluster contain only an avian chip vocalisation. Panel C features the spectrogram of an audio clip from the most negative sub-cluster along the t-SNE axis 2. Audio clips within this sub-cluster primarily contain vocalisations from the aggregated Setophaga class. Panel D displays the spectrogram of an audio clip from the most positive cluster along t-SNE axis 1. Audio clips within this cluster predominantly consist of Red-breasted Nuthatch vocalisations.