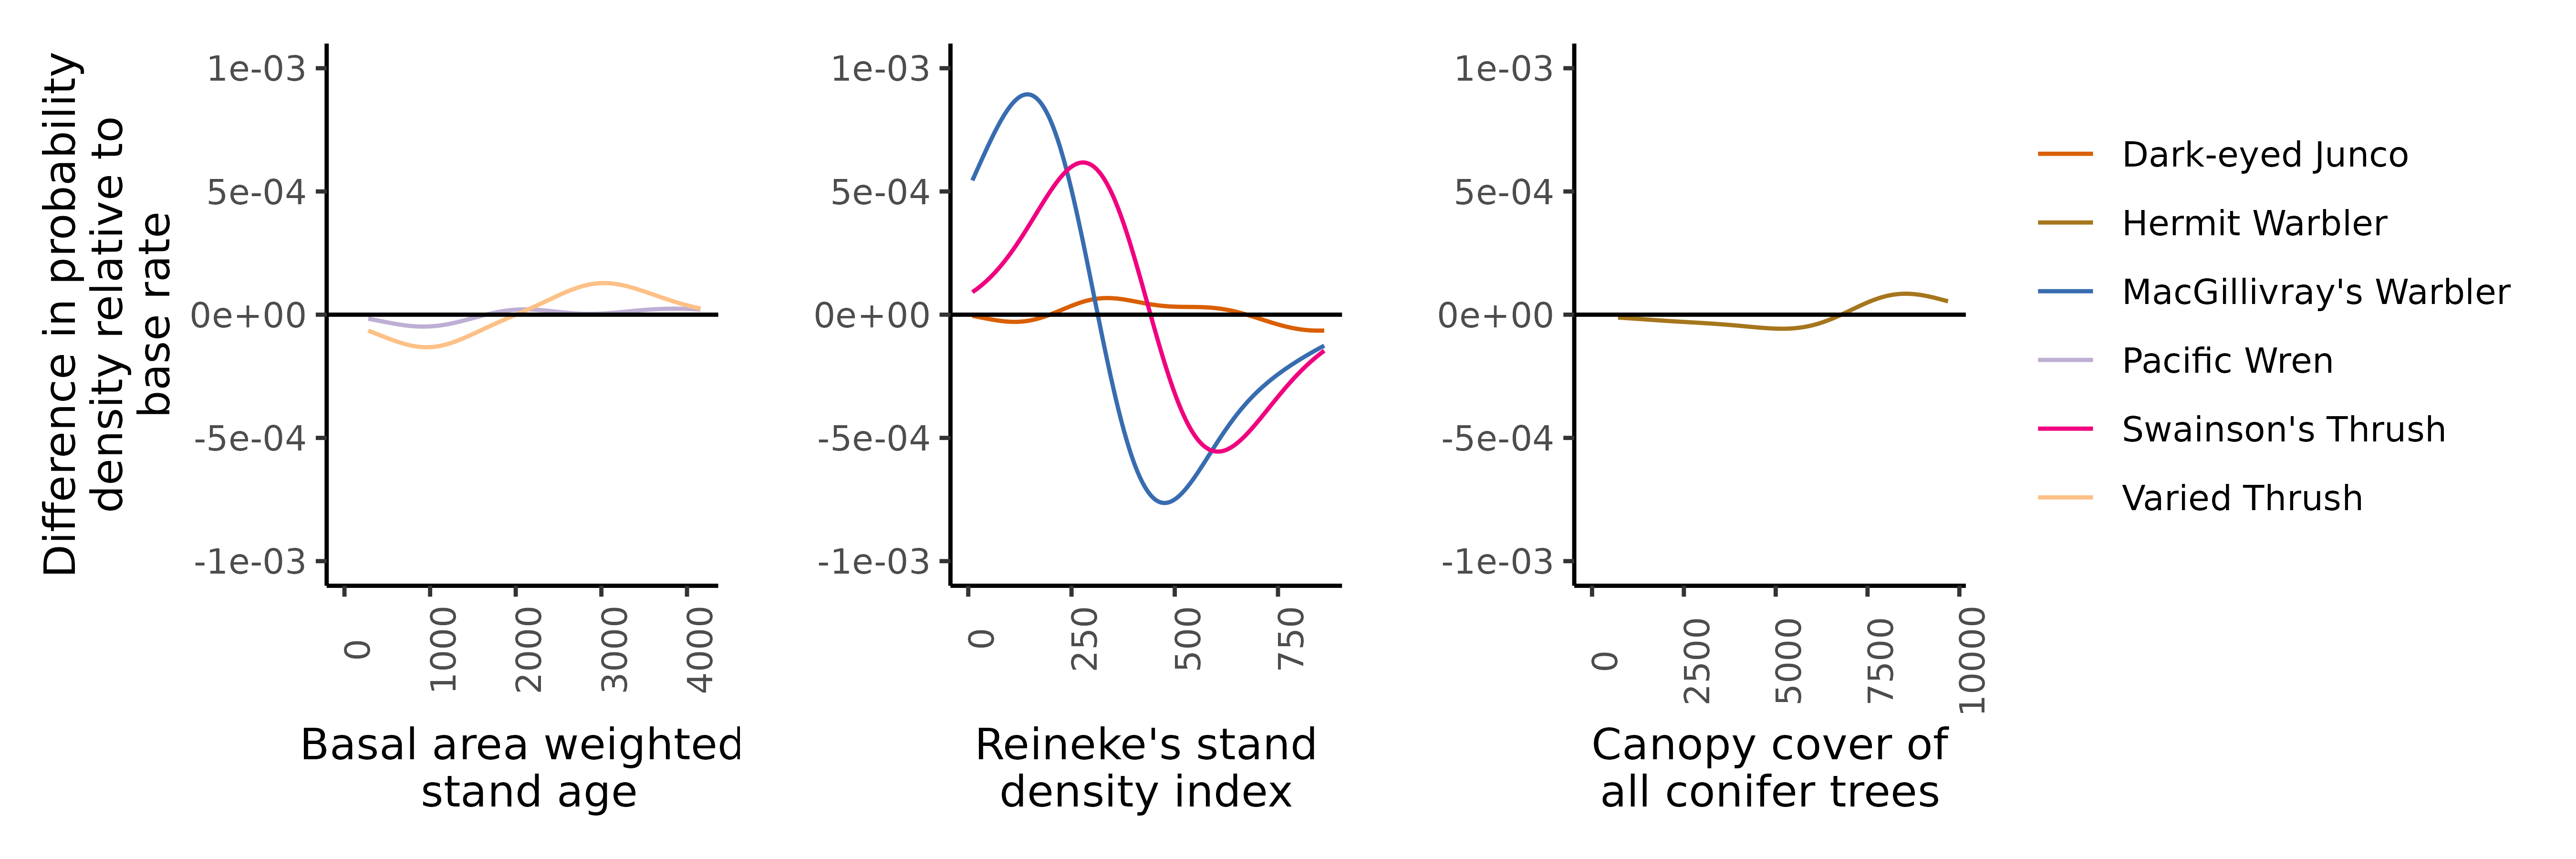
Kernel density plots of species occurrence across gradients of Basal area weighted stand age (bandwidth = 2000), Reineke’s stand density index (bandwidth = 500) and canopy cover of conifer trees (bandwidth = 5000). The species-specific probability densities are shown relative to the base rate of sampling occurrence across each environmental gradient. Specialist species with respect to an environmental gradient should show higher or lower probabilities relative to the sampling base rate within some range of the environmental gradient (i.e. > or < 0), whereas generalist species for a given environmental gradient should match the sampling base rate of occurrence (i.e. ~ 0).