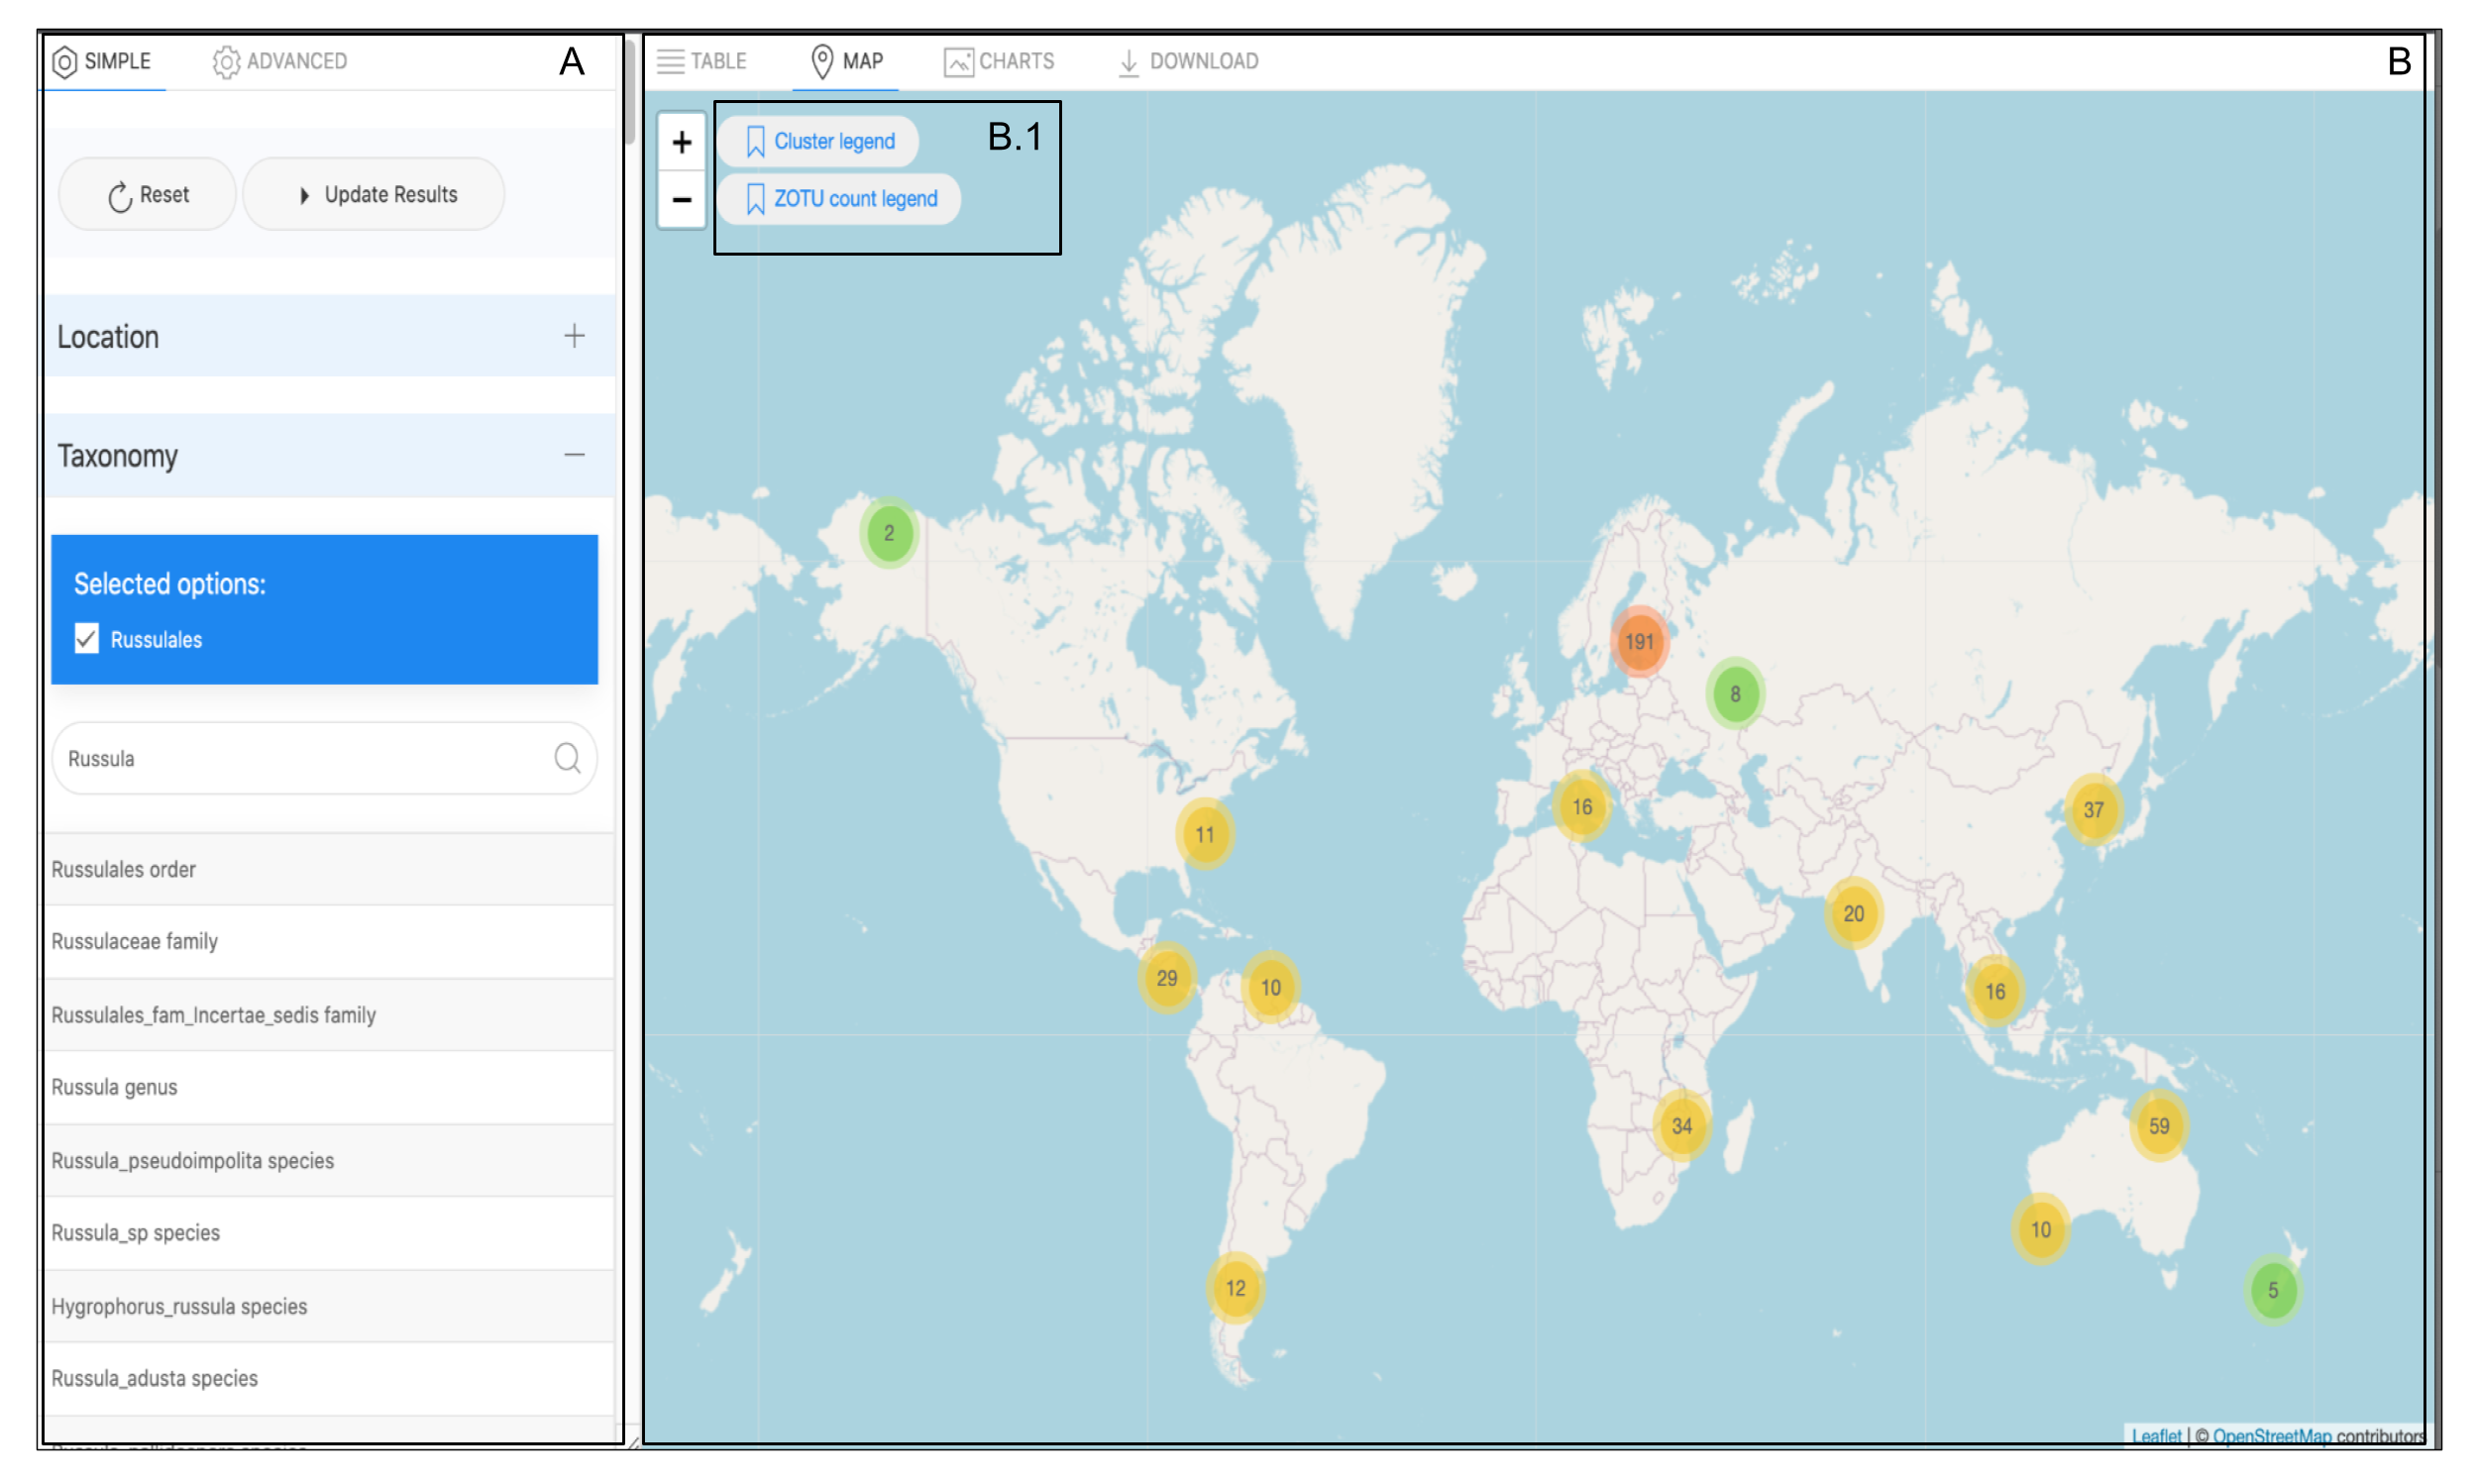
Illustration of the data map view alongside the Biodiversity Search tool (Fig 11A). The map view is initiated by clicking on the Map Tab (Fig 11B). Two legends displayed on the map guide the visualisation (Fig 11B1).
|
|
||
|
Illustration of the data map view alongside the Biodiversity Search tool (Fig 11A). The map view is initiated by clicking on the Map Tab (Fig 11B). Two legends displayed on the map guide the visualisation (Fig 11B1). |
||
| Part of: Martorelli I, Pooryousefi A, van Thiel H, Sicking F, Ramackers G, Merckx V, Verbeek F (2024) Multiple graphical views for automatically generating SQL for the MycoDiversity DB; making fungal biodiversity studies accessible. Biodiversity Data Journal 12: e119660. https://doi.org/10.3897/BDJ.12.e119660 |