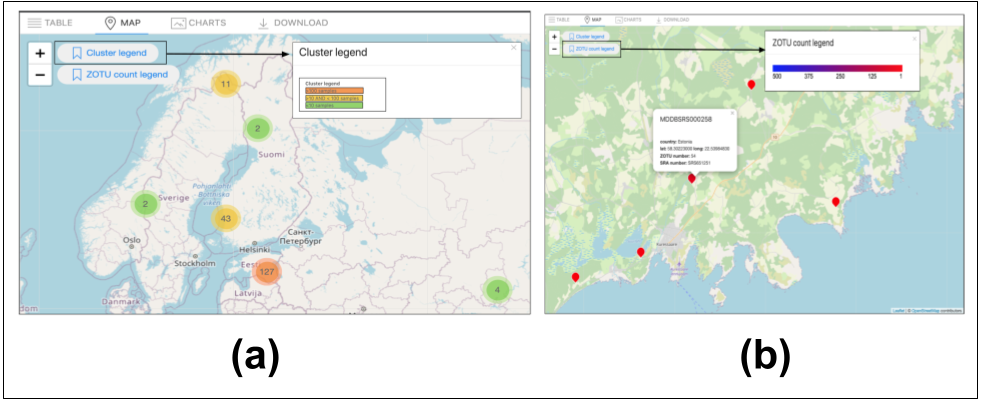
Map view example of a geographical region. (a) Number of sample representation of the map view; (b) Sequence variant diversity (ZOTU richness) display for one soil plot (sample SRS651251).
|
|
||
|
Map view example of a geographical region. (a) Number of sample representation of the map view; (b) Sequence variant diversity (ZOTU richness) display for one soil plot (sample SRS651251). |
||
| Part of: Martorelli I, Pooryousefi A, van Thiel H, Sicking F, Ramackers G, Merckx V, Verbeek F (2024) Multiple graphical views for automatically generating SQL for the MycoDiversity DB; making fungal biodiversity studies accessible. Biodiversity Data Journal 12: e119660. https://doi.org/10.3897/BDJ.12.e119660 |