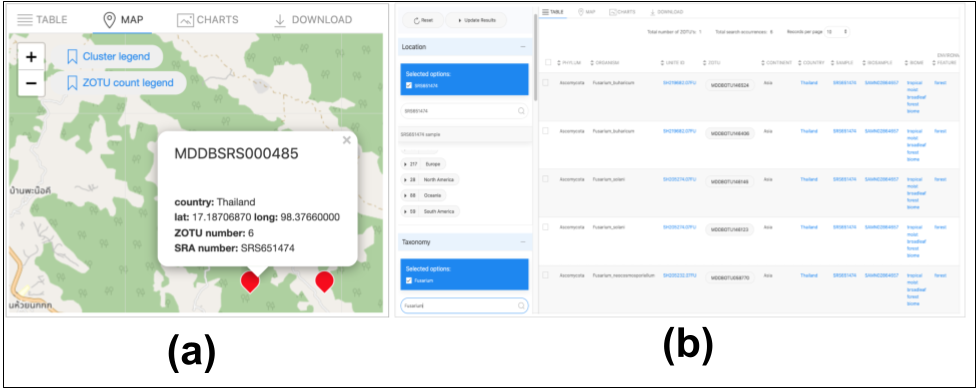
Example of occurrence data display using the map view and data table view simultaneously. a. Map view: The markup of plot MDDBSRS000485 (SRA Sample ID SRS651474) displaying the number of ZOTUs observed; b. Table View: The six records belonging to the Fusarium genus associated with the SRA Sample SRS651474.

 
  Part of: Martorelli I, Pooryousefi A, van Thiel H, Sicking F, Ramackers G, Merckx V, Verbeek F (2024) Multiple graphical views for automatically generating SQL for the MycoDiversity DB; making fungal biodiversity studies accessible. Biodiversity Data Journal 12: e119660. https://doi.org/10.3897/BDJ.12.e119660