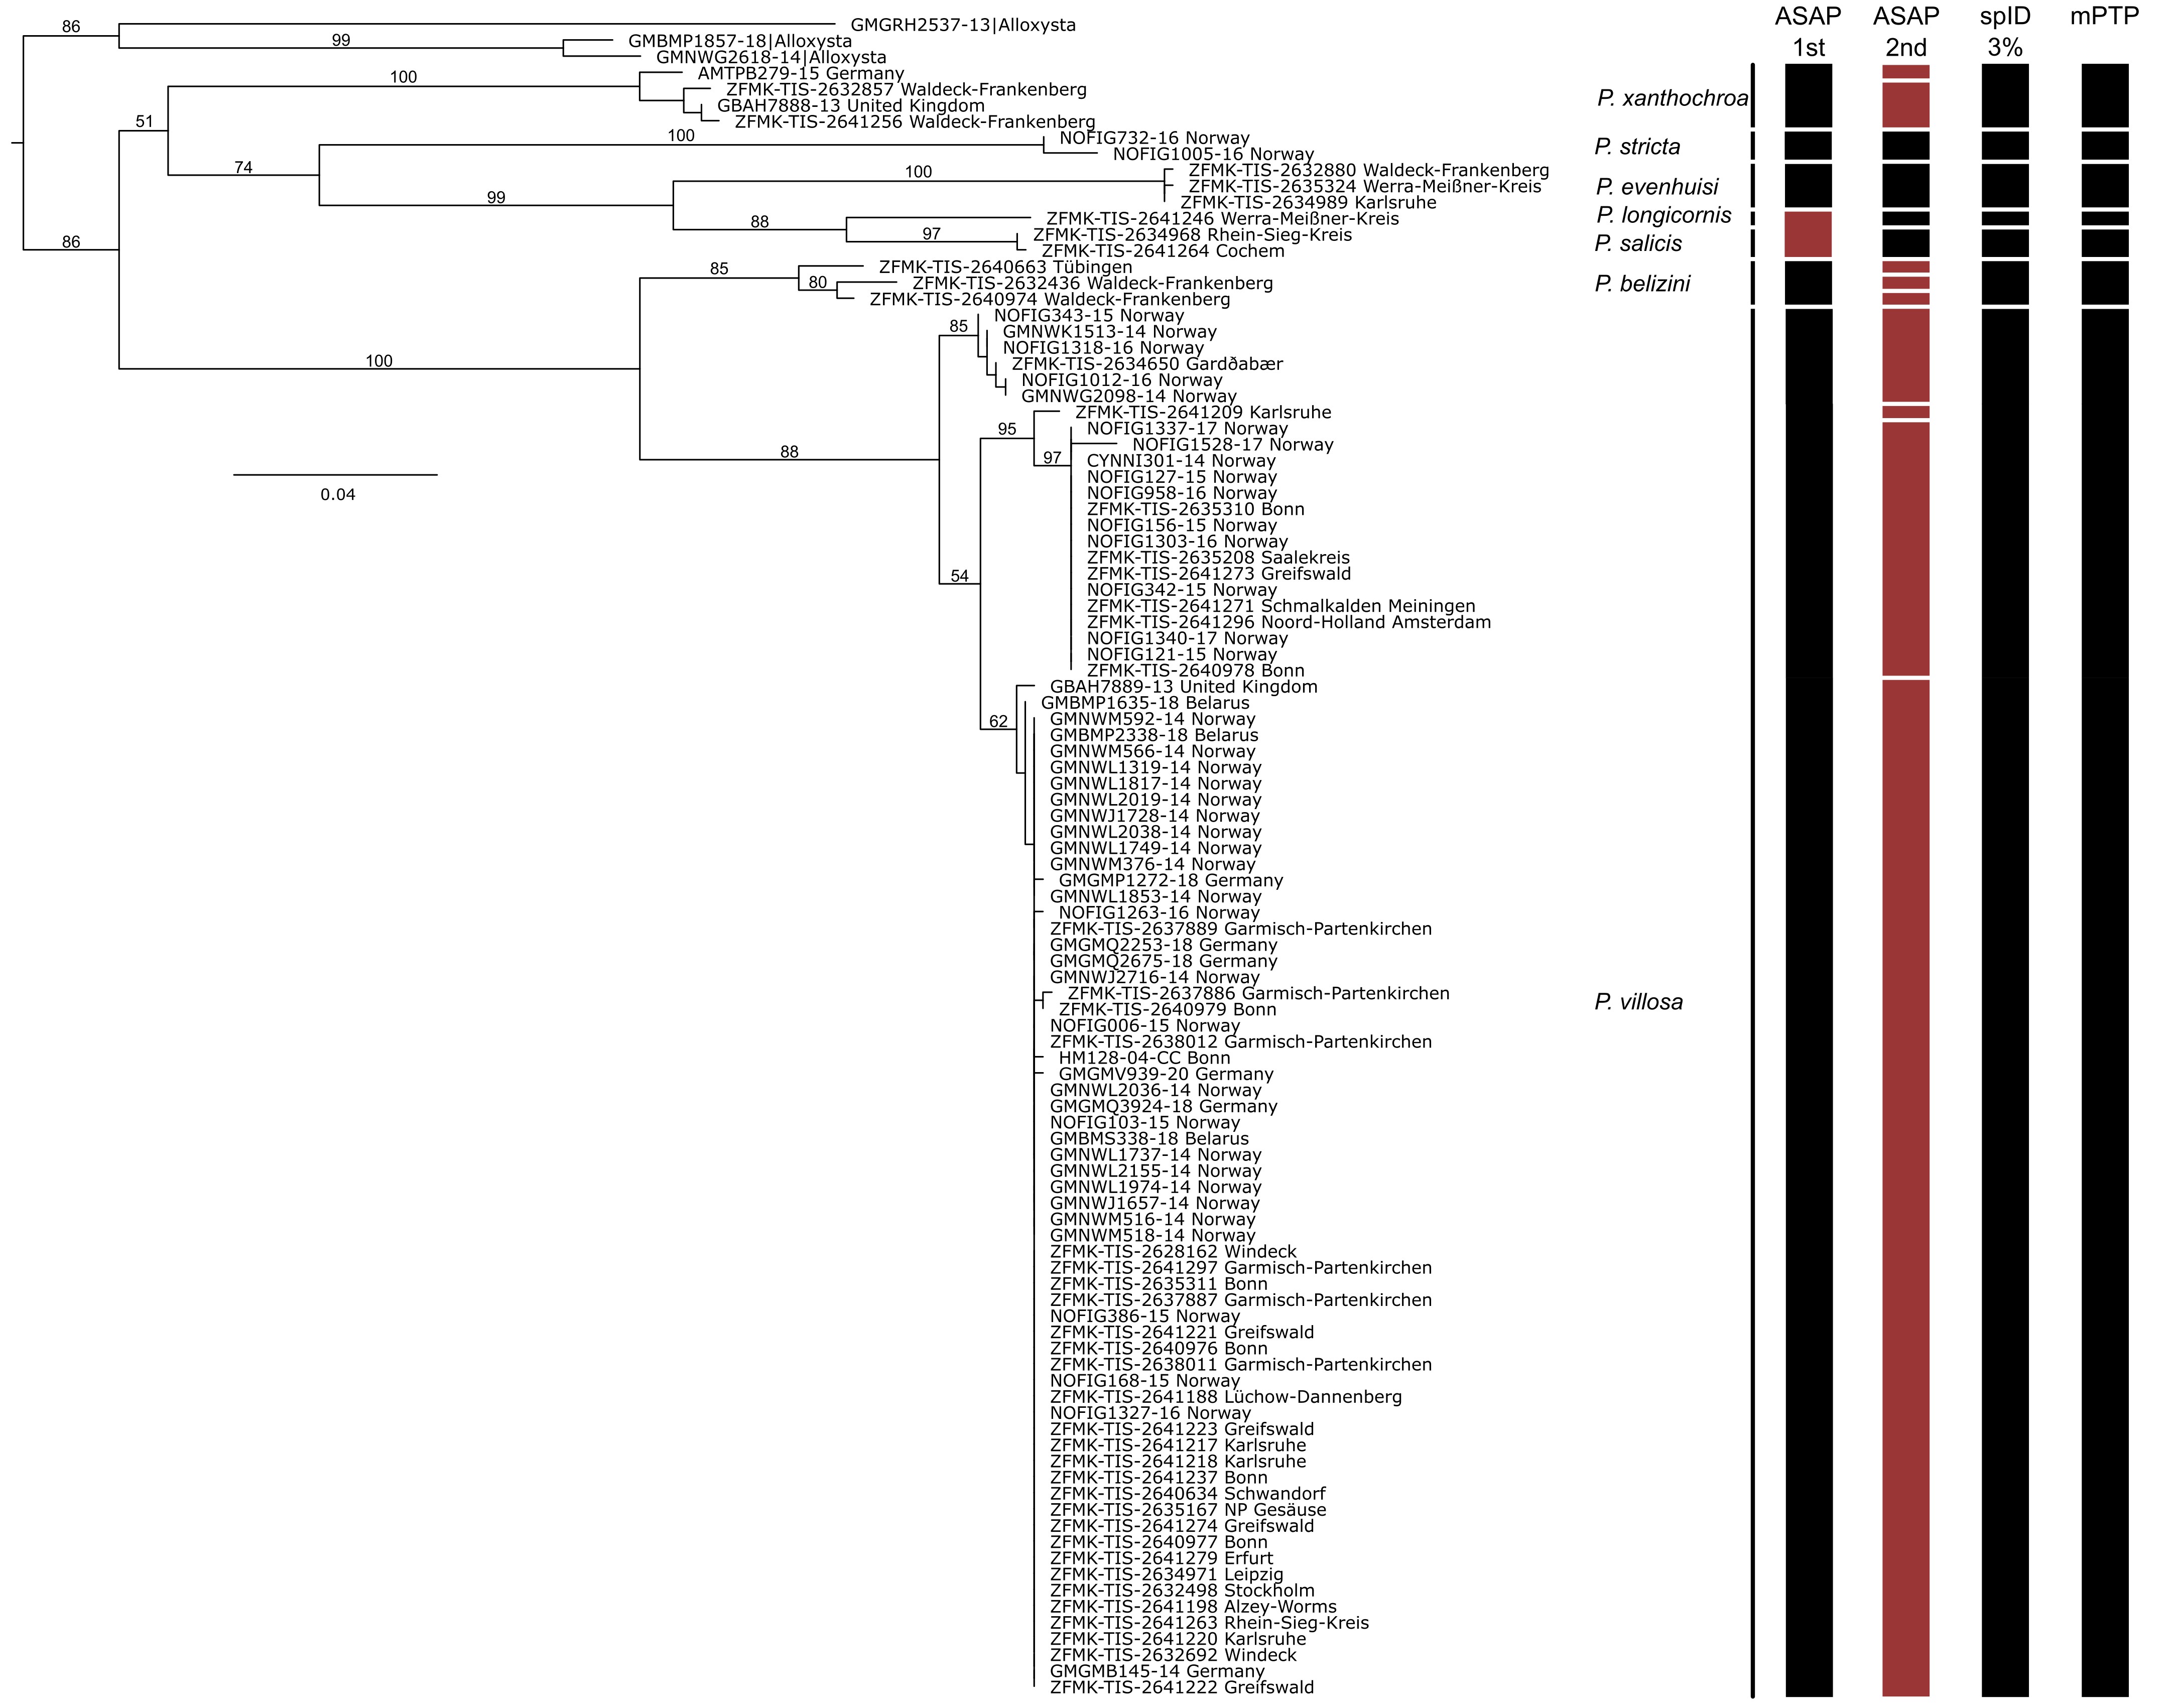
Maximum Likelihood tree, based on CO1 barcode data (produced with IQ Tree) with ultrafast bootstrap values shown on the branches. The clusters of the species delimitation algorithms are shown to the right, summarised as bars (ASAP 1st and 2nd, multirate PTP and Species Identifier with a threshold of 3%). The black bars indicate delimitation results that match our morphological identifications, while red bars represent conflicts between morphology and molecular species delimitation.