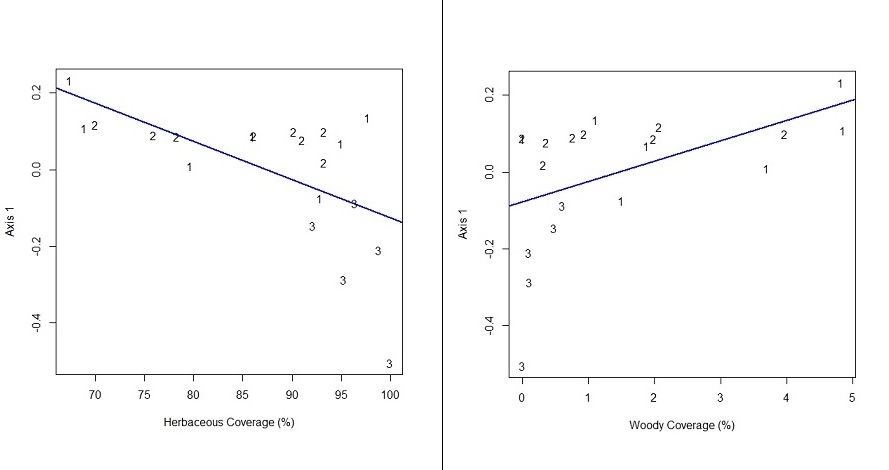
Linear regression indicating the correlation between the groups of habitats formed by the floristic similarity of the plots (Axis 1 = scores NMDS 1) and the coverage (%) of herbaceous plants (live + dead; Y = 0.873429 – 0.009996×X; R2= 0.3199) and woody plants (sub-shrub + shrub + tree; Y = -0.07886 + 0.05336×X; R2=0.2042). Groups of habitat: 1 – mosaic of savanna park-land with shrubby savanna / well drained (SAV-1); 2 – shrubby savanna / well drained (SAV-2); 3 – wet grassland / poorly drained (SAV-3).