![]() |
||
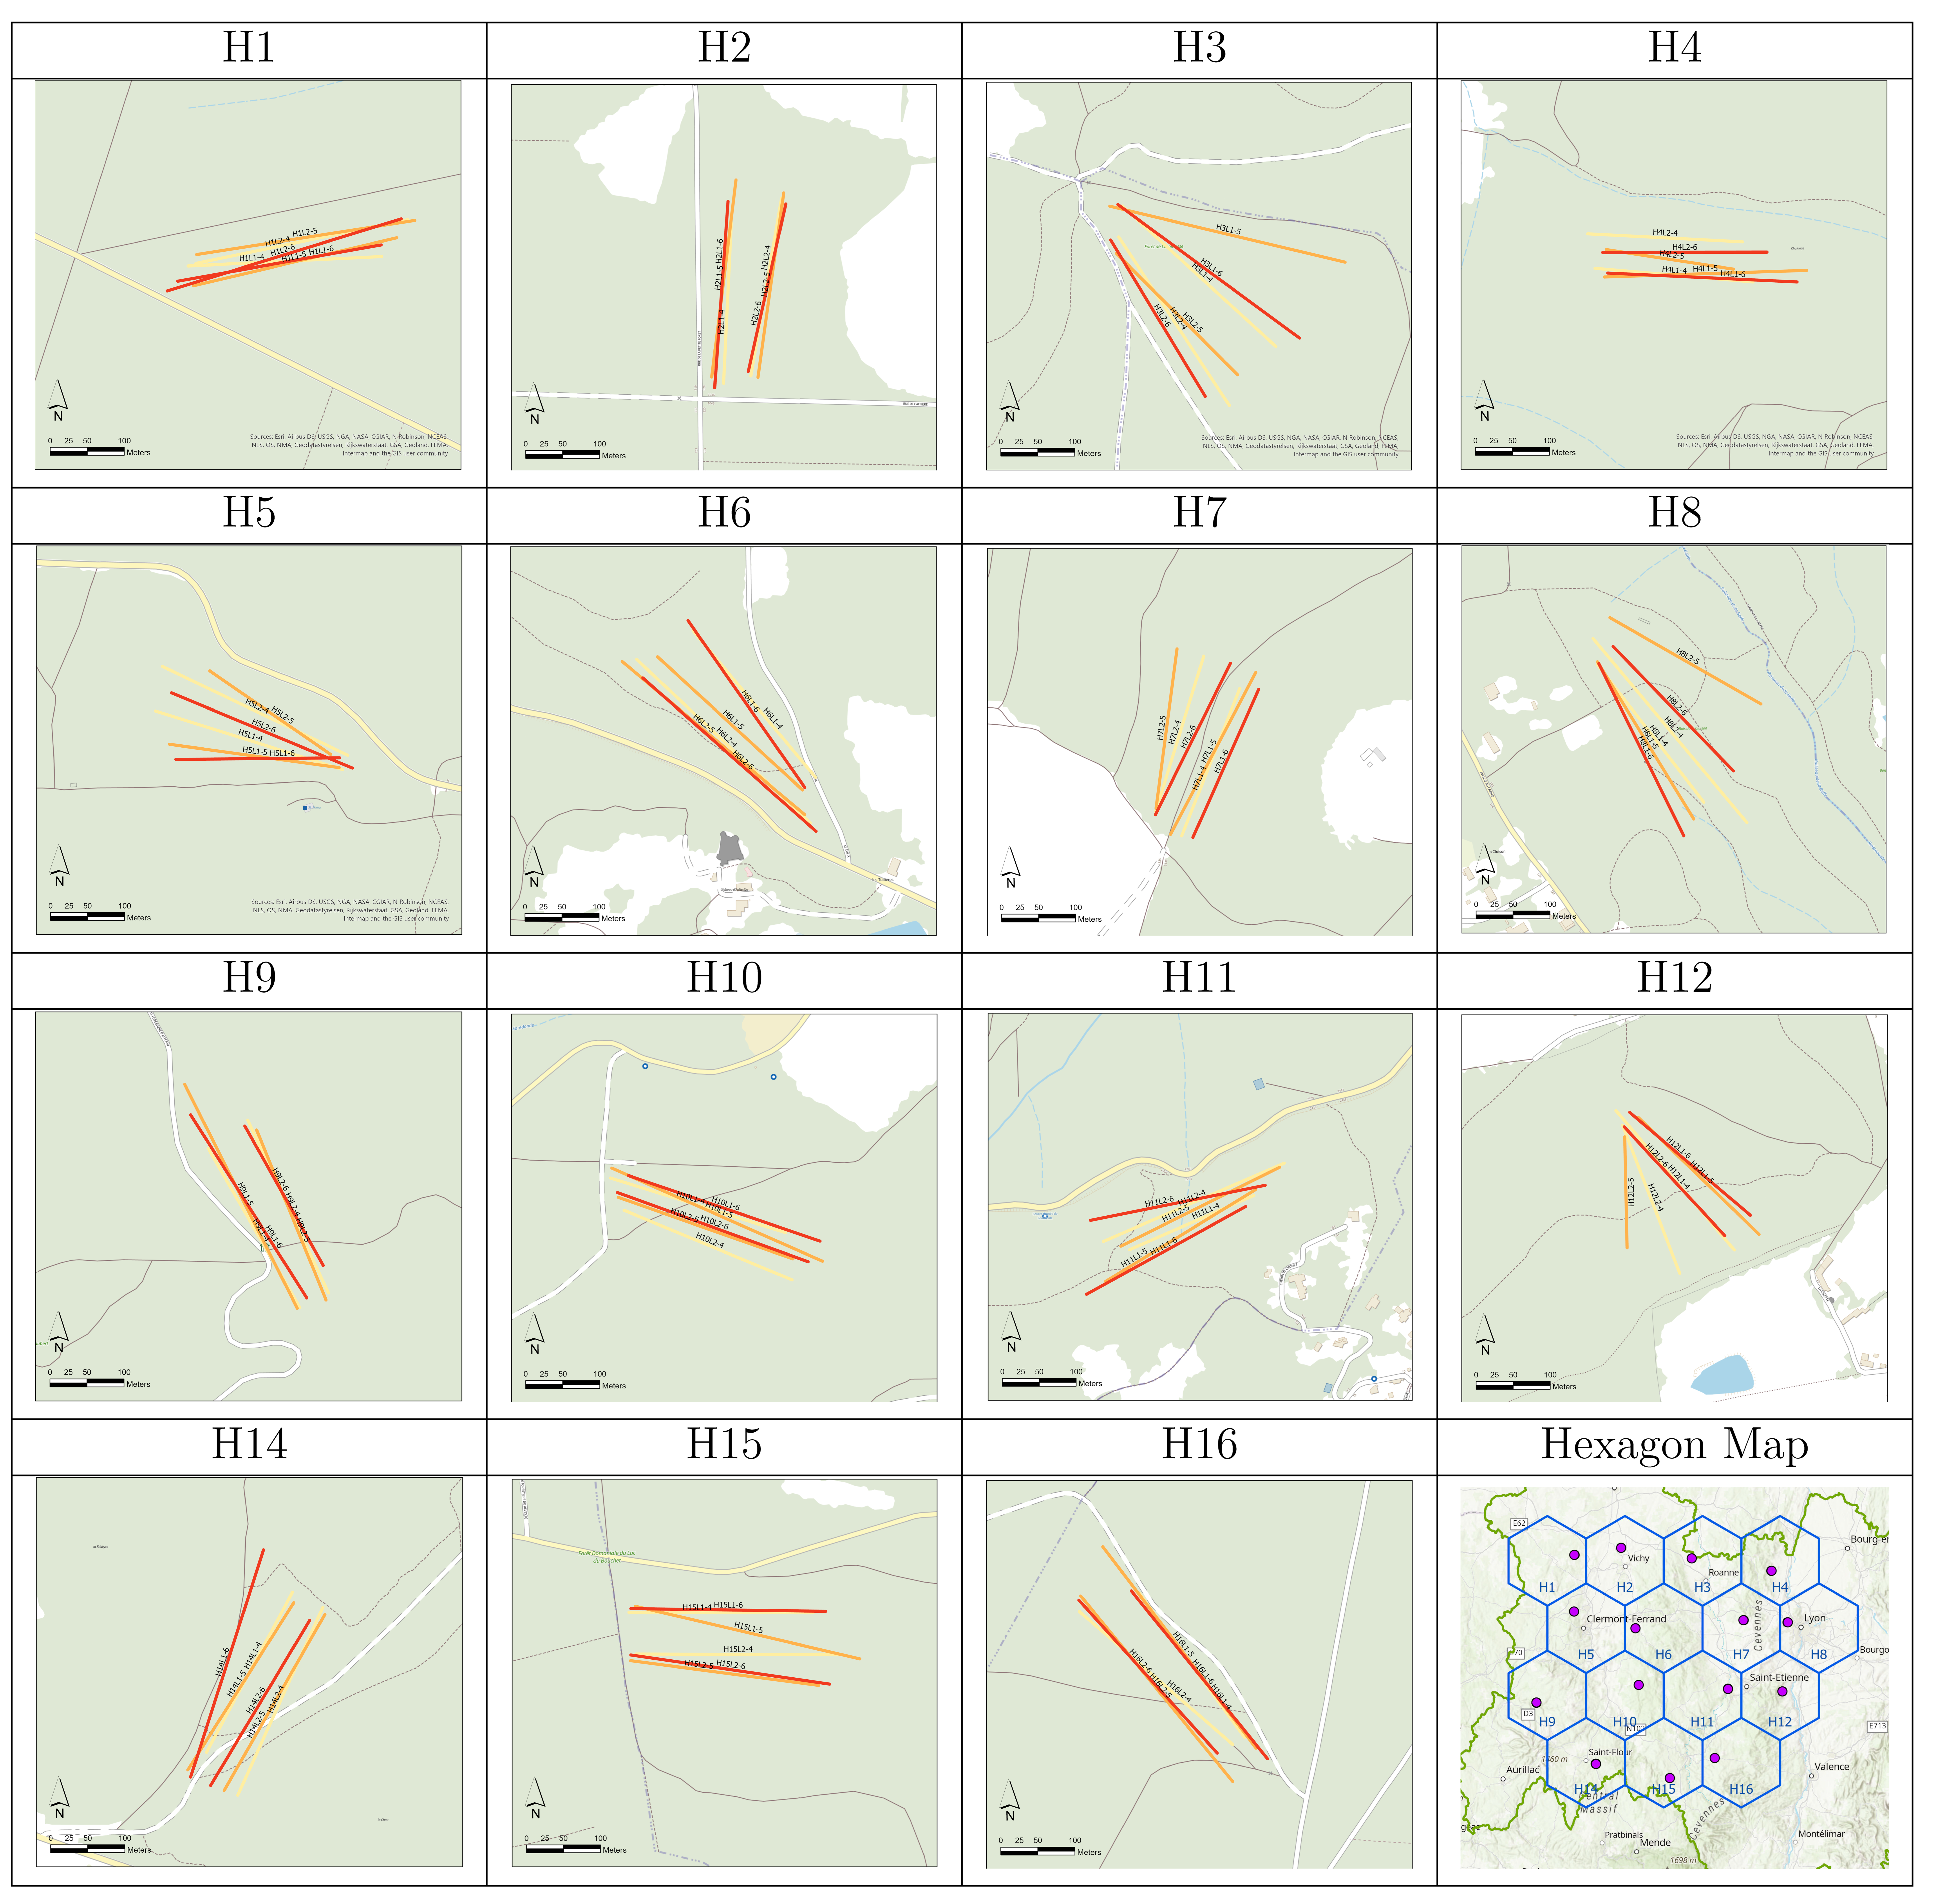
Location of the six sampling transects (2 transects x 3 months) in the 15 sites of the study. H = hexagon identifier according to hexagon map (Fig. 1). Transect (T1, T2) colours indicate the month: April (4) in yellow; May (5) in orange; June (6) in red. |
||
Part of: Lebert I, Poux V, René-Martellet M, Chalvet-Monfray K, Vourc'h G, Bord S (2025) A dataset of the abundance of Ixodes spp. ticks in forests of the Auvergne-Rhône-Alpes Region (France). Biodiversity Data Journal 13: e142266. https://doi.org/10.3897/BDJ.12.e142266 |