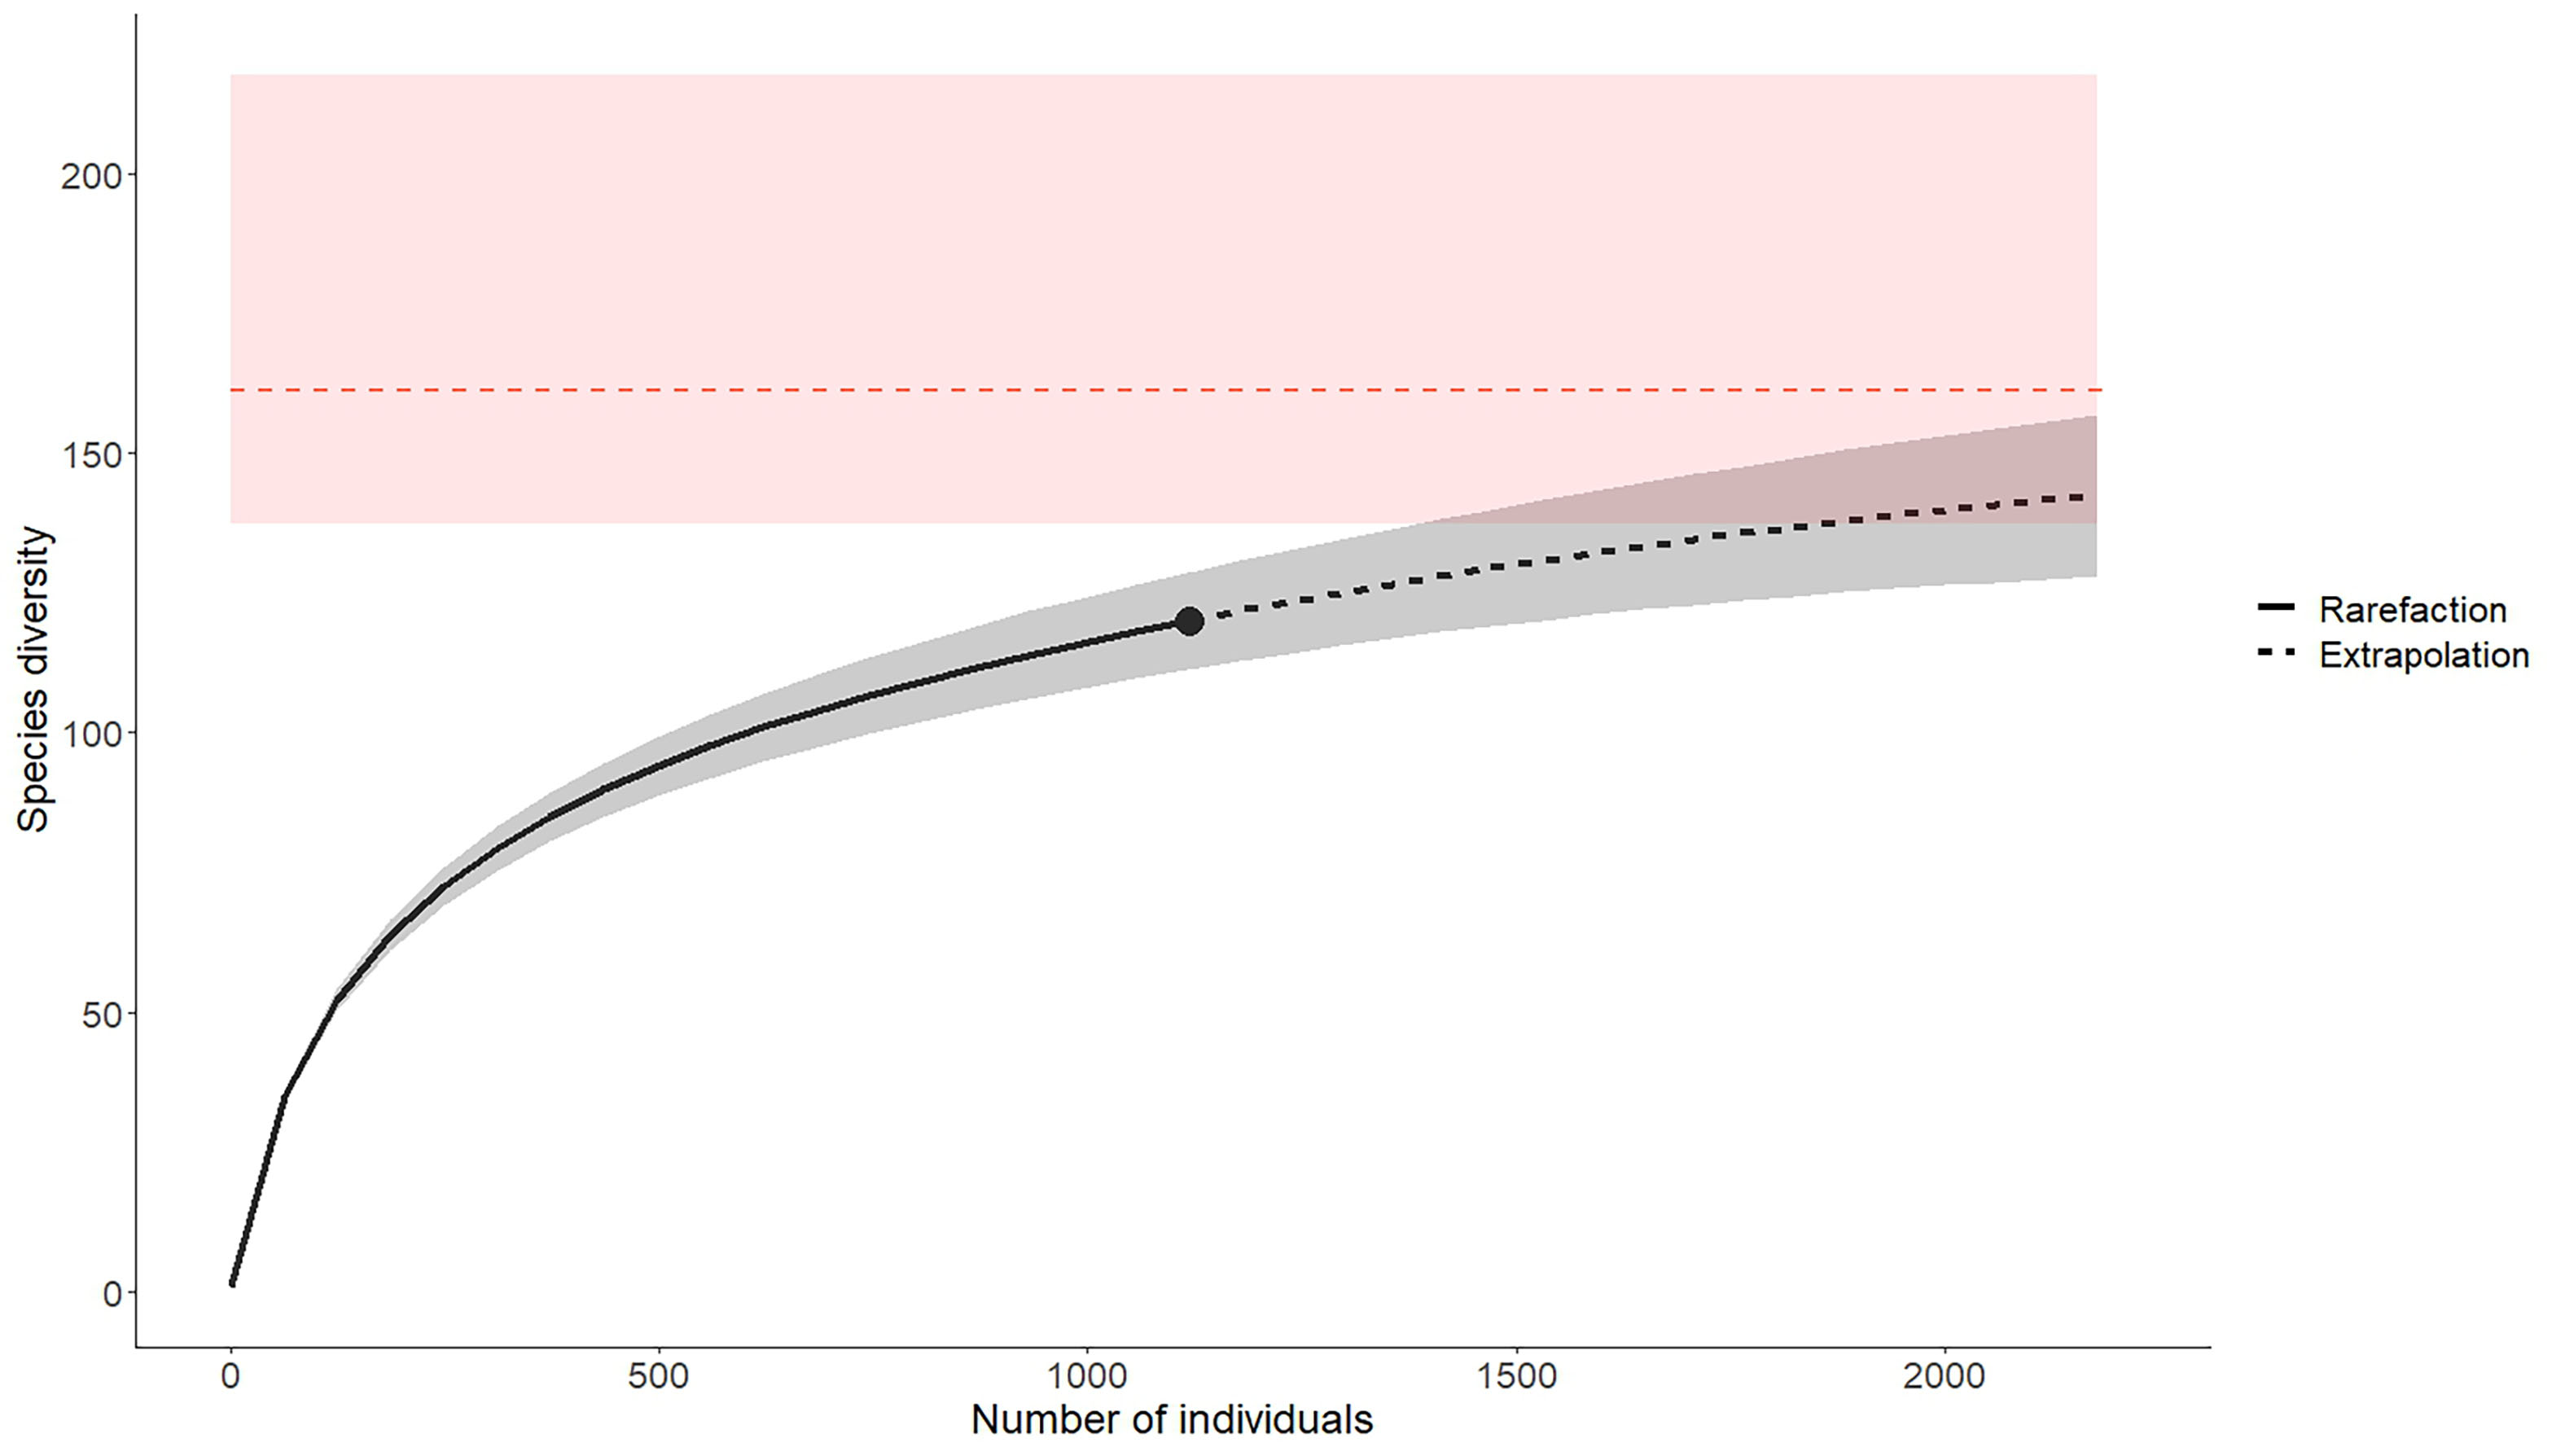
Accumulation curve and expected number of species collected in National Park of the Semois Valley (Belgium). The sampling effort is represented by the number of specimens collected (x axis). The dotted line represents the predicted number of species (y axis), based on the number of specimens collected. The total predicted species richness and the associated confidence interval (in red) are calculated using the Chao method.