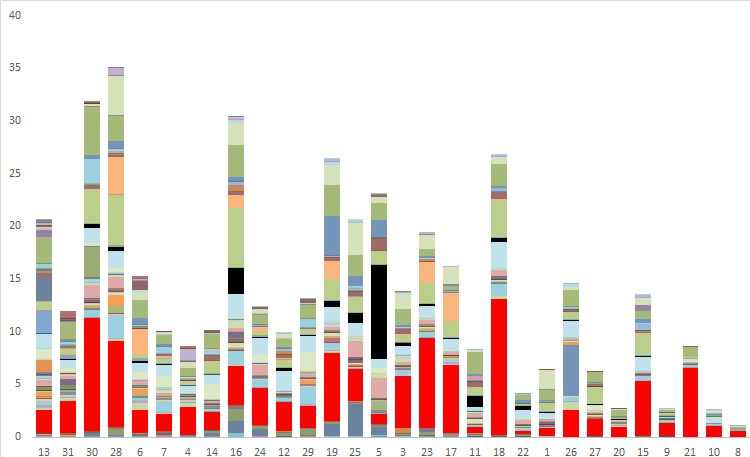
Stacked bar chart of phorid fly catch from one year of sampling at each of 30 sites from BioSCAN project. Each color represents a different species, each bar represents a single site. Black - Megaselia marquezi Hartop et al.; red - Megaselia agarici (Lintner). Vertical axis- number of speciemens; horizontal axis- trapping sites (see