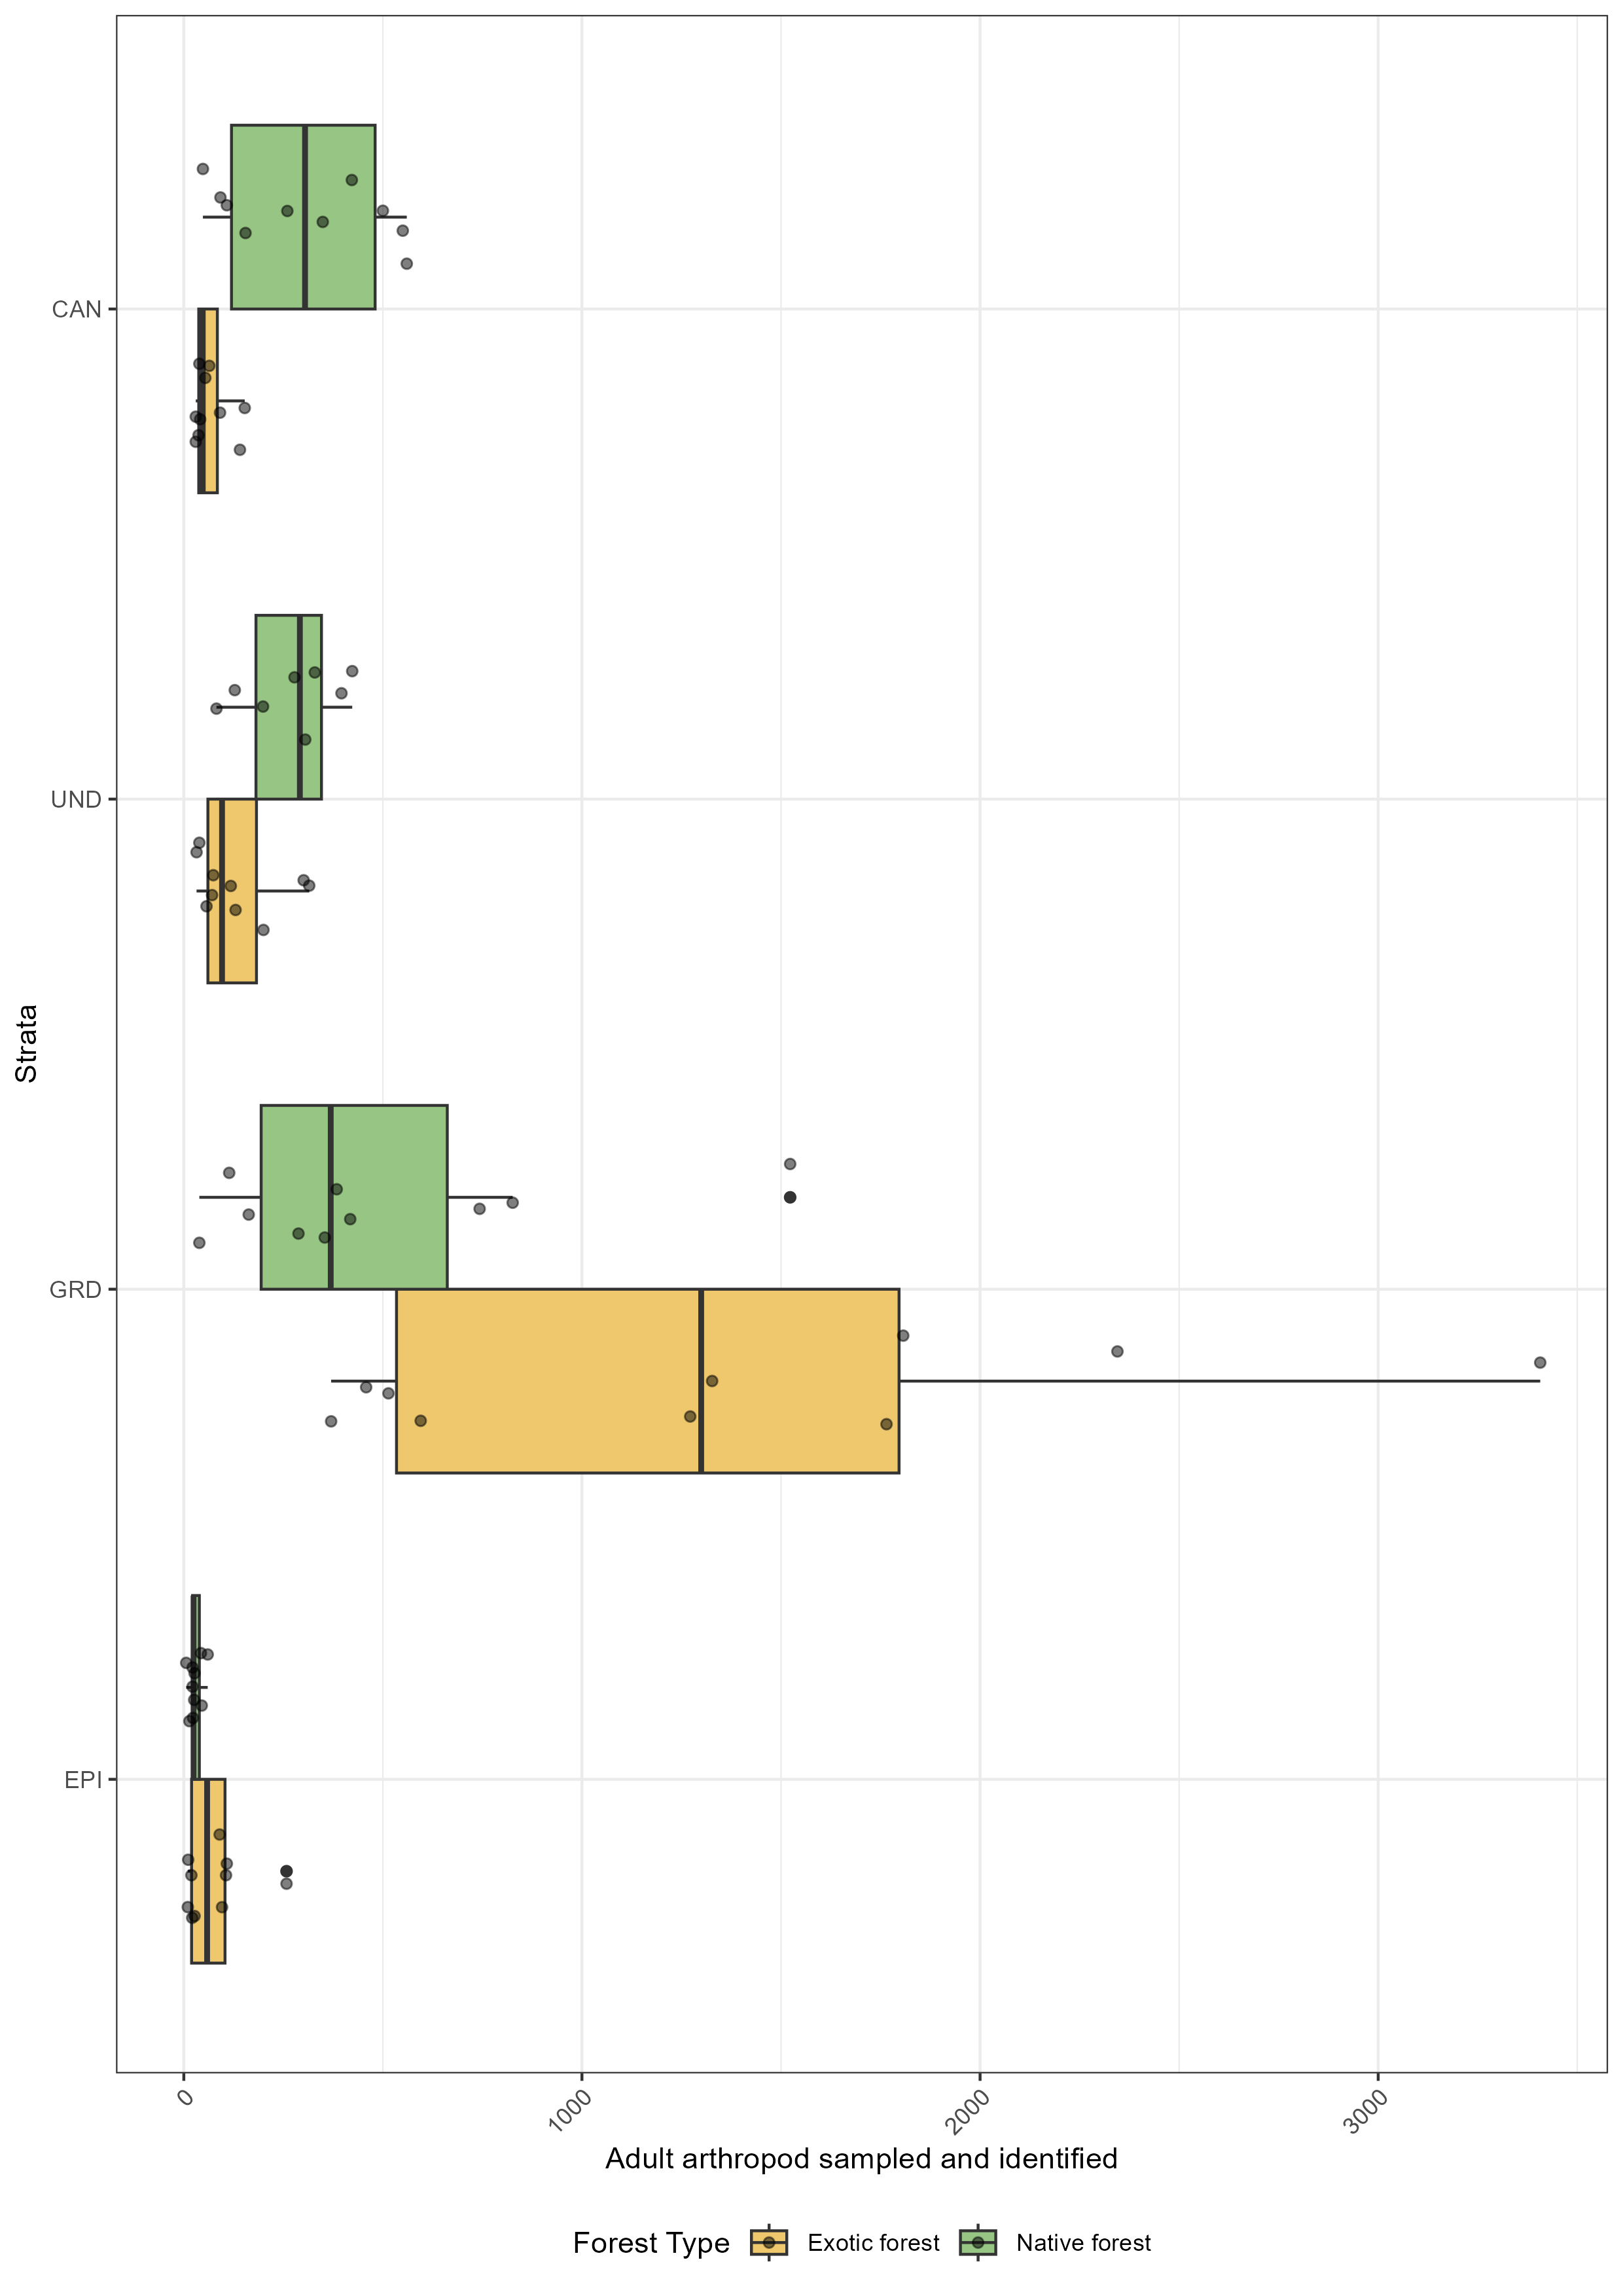
Abundance of arthropods across different forest strata in exotic and native forests.
The x-axis represents the total number of arthropods collected and identified, while the y-axis indicates the sampled strata (EPI: epigean, GRD: ground, UND: understorey, CAN: canopy). Points represent individual site values for a given forest type. Bars are colour-coded to distinguish between exotic forests (yellow) and native forests (green).
Kruskal-Wallis tests revealed statistically significant differences in adult abundance total across the strata of exotic forest (χ2(3) = 24.2, n = 40, p < 0.001) and native forest (χ2(3) = 20.8, n = 38, p < 0.001).
In exotic forest, Kruskal-Wallis effect size (η2[H]) for the difference in adult abundance total was 0.59 (95% CI [0.35, 0.80], n = 40), indicating a large effect. In native forest, the effect was also large with 0.52 (95% CI [0.29, 0.73]).