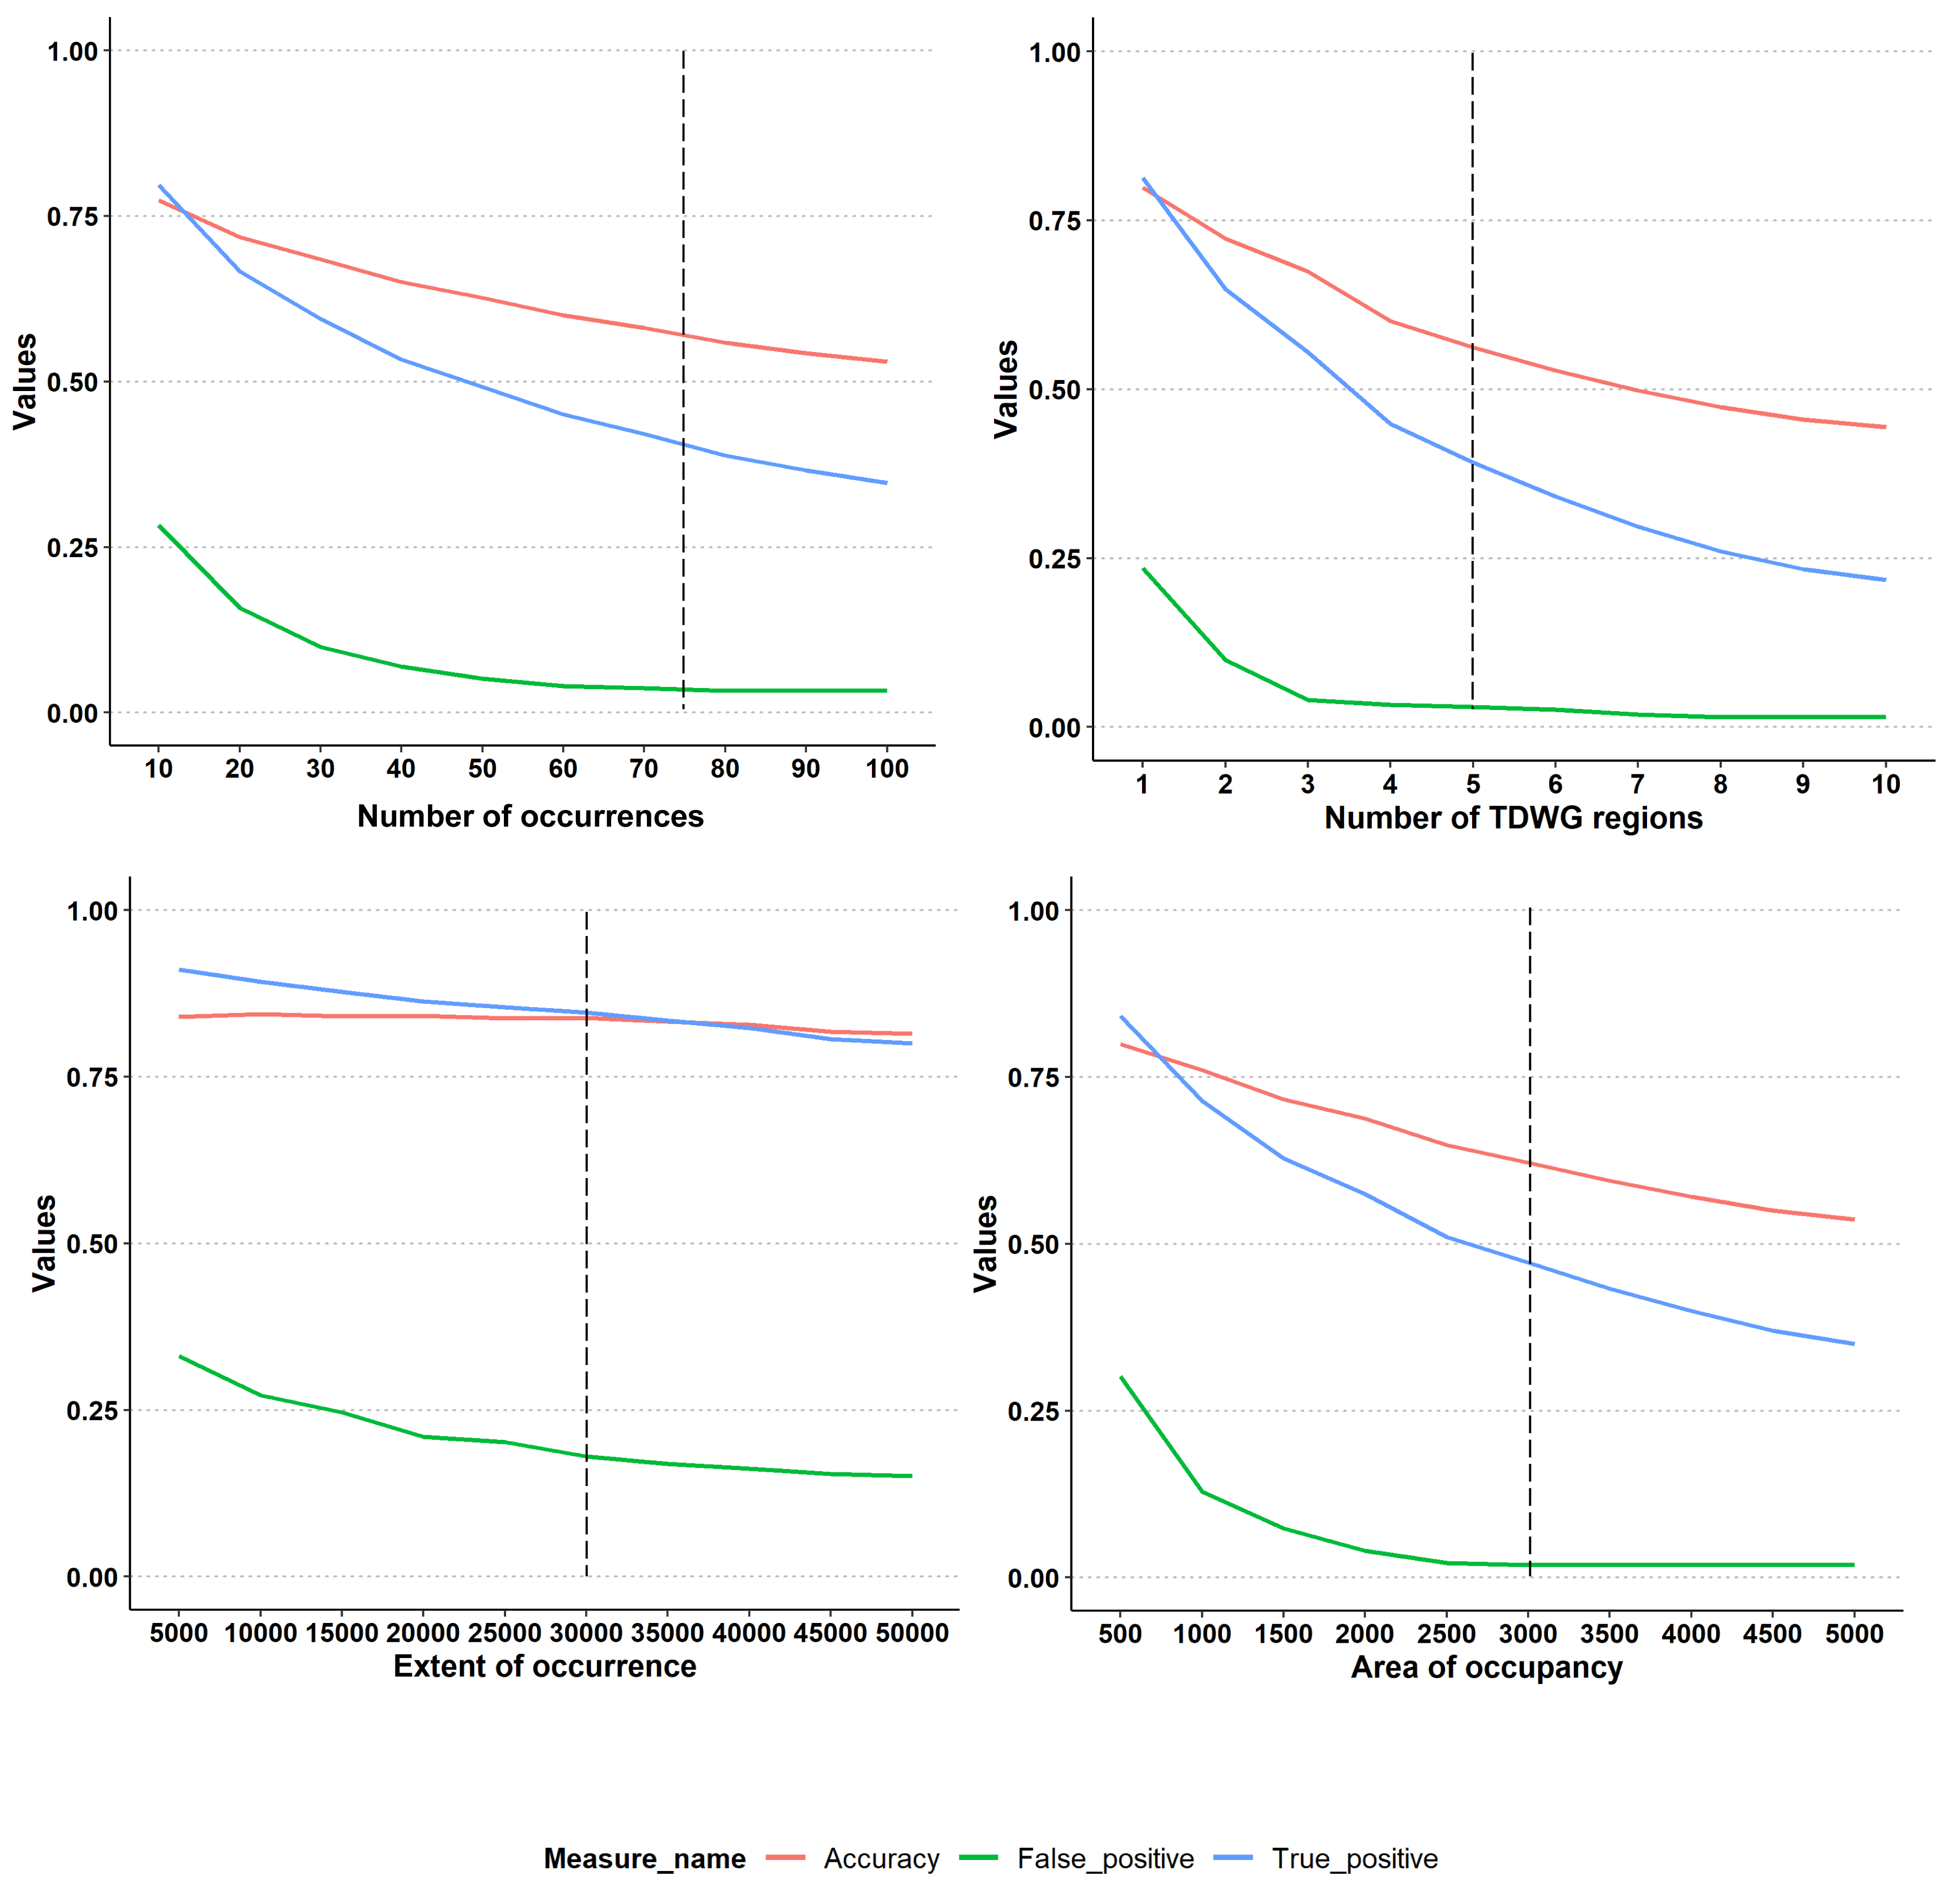
Sensitivity analysis to determine thresholds for Least Concern for each parameter: number of specimens, number of TDWG regions, extent of occurrence and area of occupancy. Vertical dashed line shows the chosen threshold (also reported in Table
|
|
||
|
Sensitivity analysis to determine thresholds for Least Concern for each parameter: number of specimens, number of TDWG regions, extent of occurrence and area of occupancy. Vertical dashed line shows the chosen threshold (also reported in Table |
||
| Part of: Bachman S, Walker BE, Barrios S, Copeland A, Moat J (2020) Rapid Least Concern: towards automating Red List assessments. Biodiversity Data Journal 8: e47018. https://doi.org/10.3897/BDJ.8.e47018 |