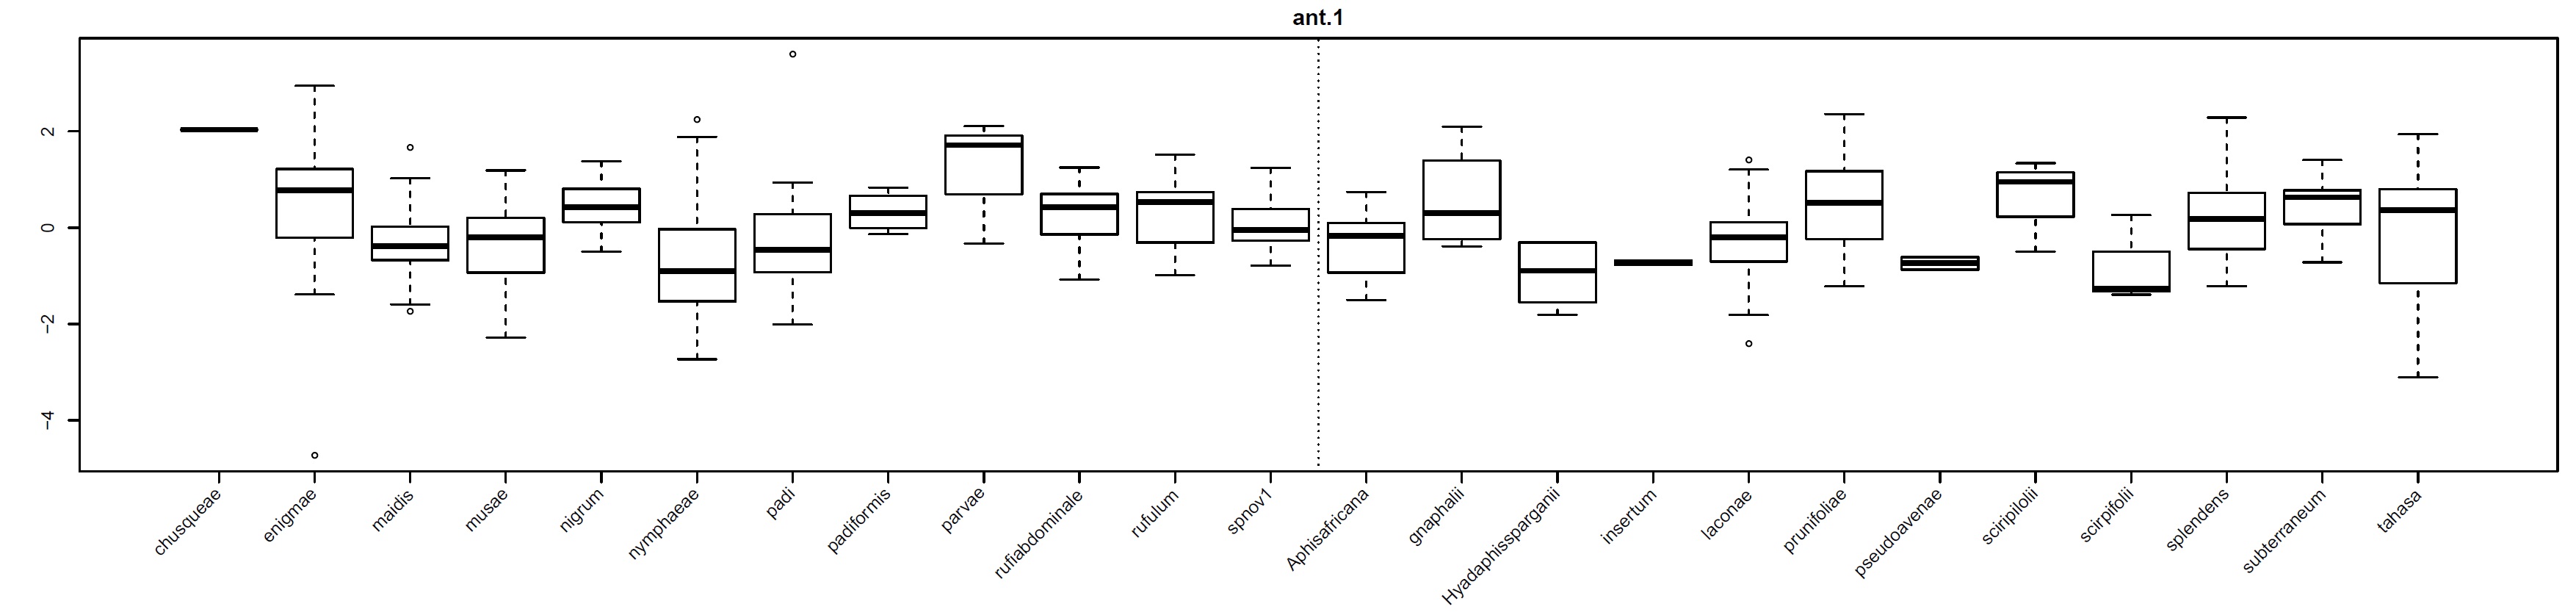
Example of box plots created for a character (length of antennal segment I here) that were used to identify outlier measurements that should be doublechecked before further analyses. Note the outliers for R. enigmae and R. padi, which were the result of miskeyed data.

 
  Part of: Skvarla M, Kramer M, Owen CL, Miller GL (2020) Reexamination of Rhopalosiphum (Hemiptera: Aphididae) using linear discriminant analysis to determine the validity of synonymized species, with some new synonymies and distribution data. Biodiversity Data Journal 8: e49102. https://doi.org/10.3897/BDJ.8.e49102