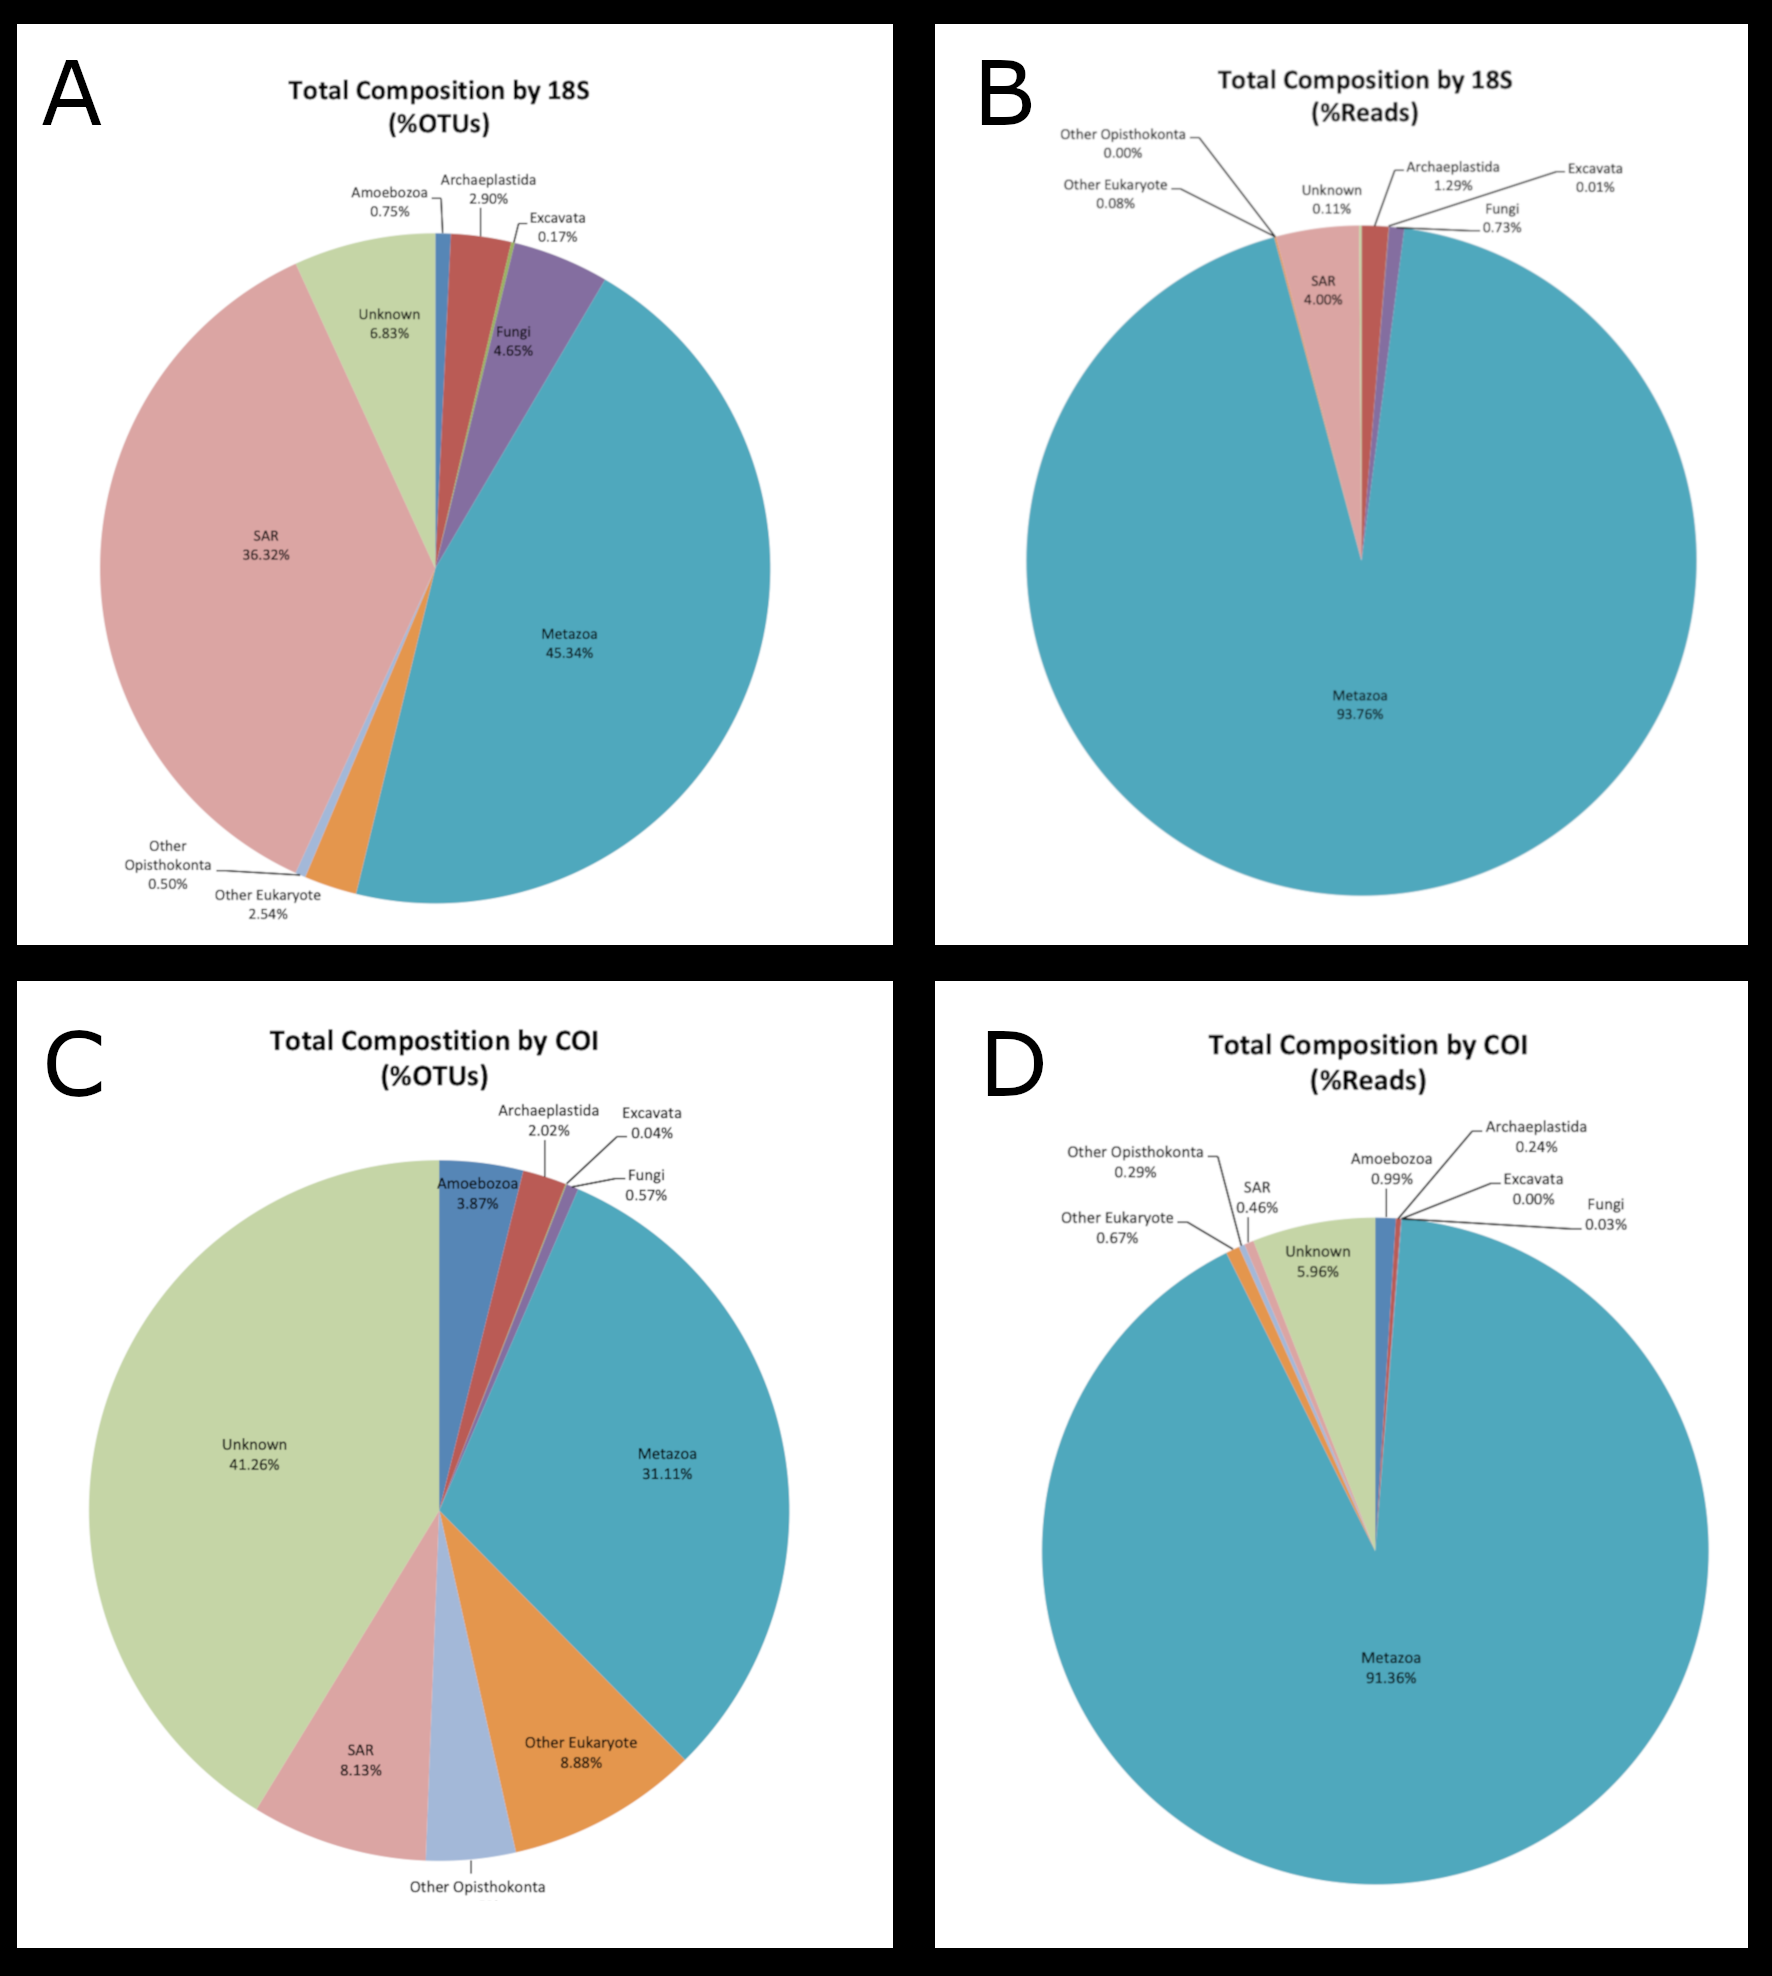
A graphical summary of the higher level composition for all samples combined by (A) the percent of OTUs as determined by 18S sequences; (B) the percent of sequence reads as determined by 18S sequences; (C) the percent of OTUs as determined by COI sequences; (D) the percent of sequence reads as determined by COI sequences.