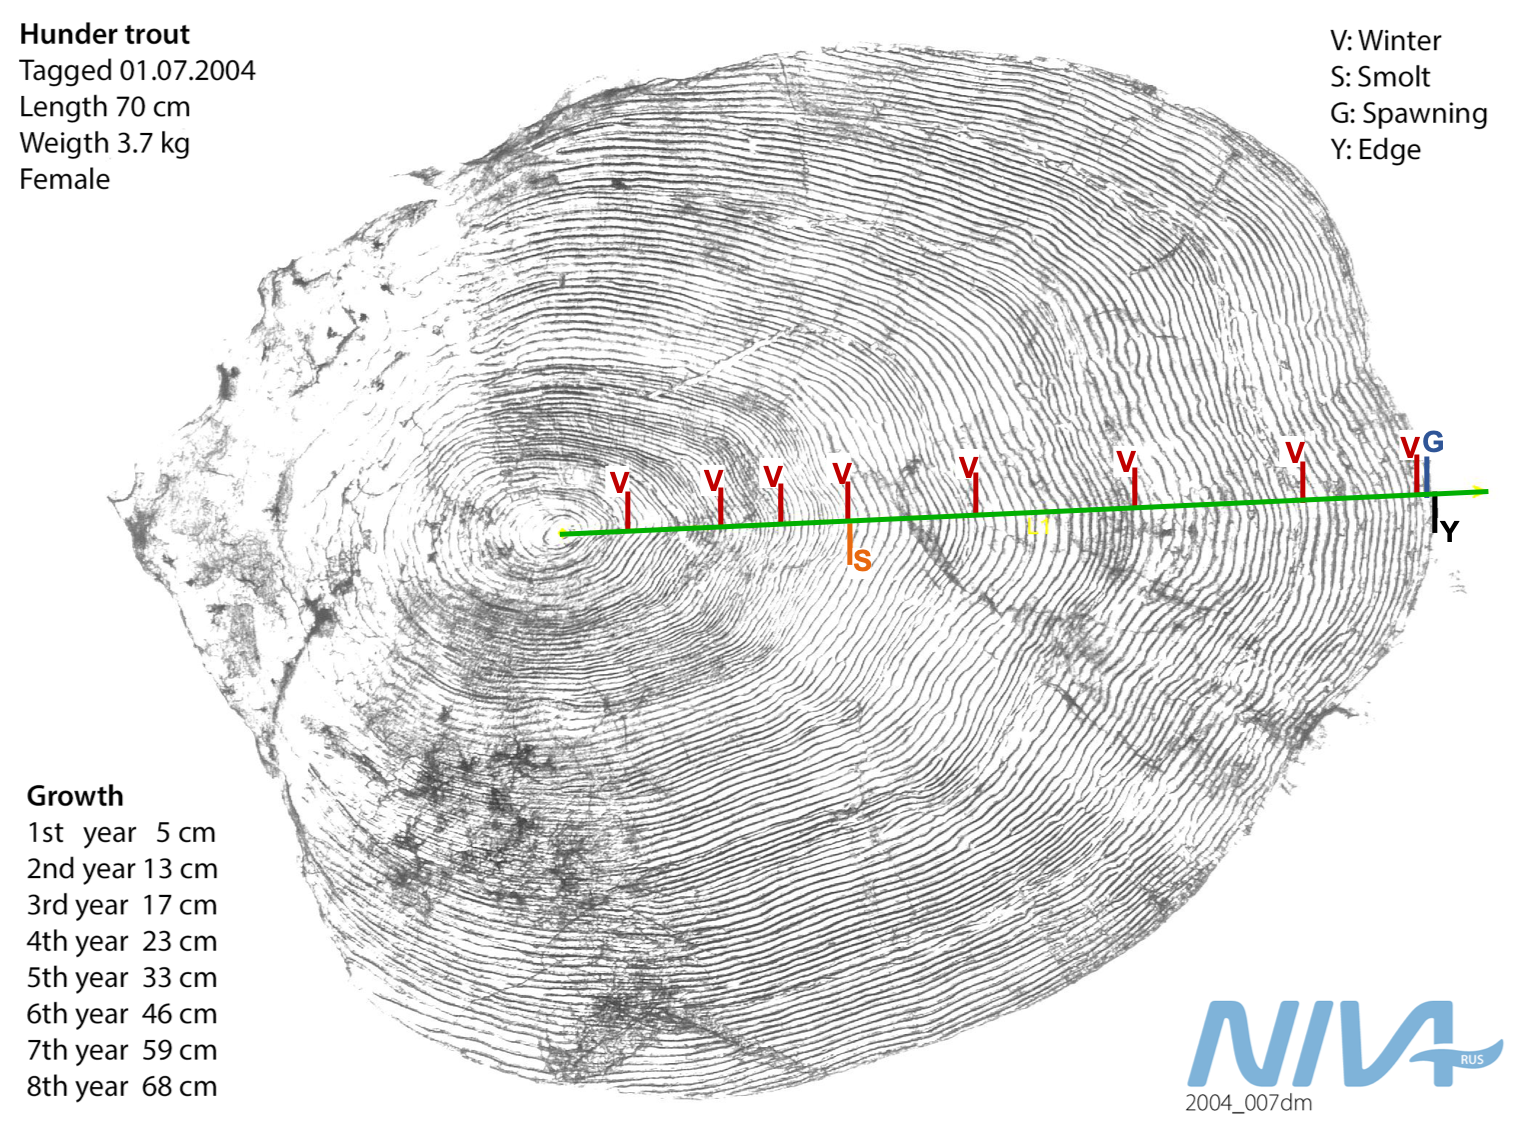
Illustration of a fish scale and interpretation of growth, development and spawning events. The green line represents the time line from hatching (centre) to the current age (the edge). Red lines indicate winters (marked "V"), where the growth is slower (denser sclerite pattern). Smoltification ("S") after the 4th winter is indicated by subsequent rapid growth. Spawning runs ("G") are followed by very slow growth during the summer proper to and during the spawning run.