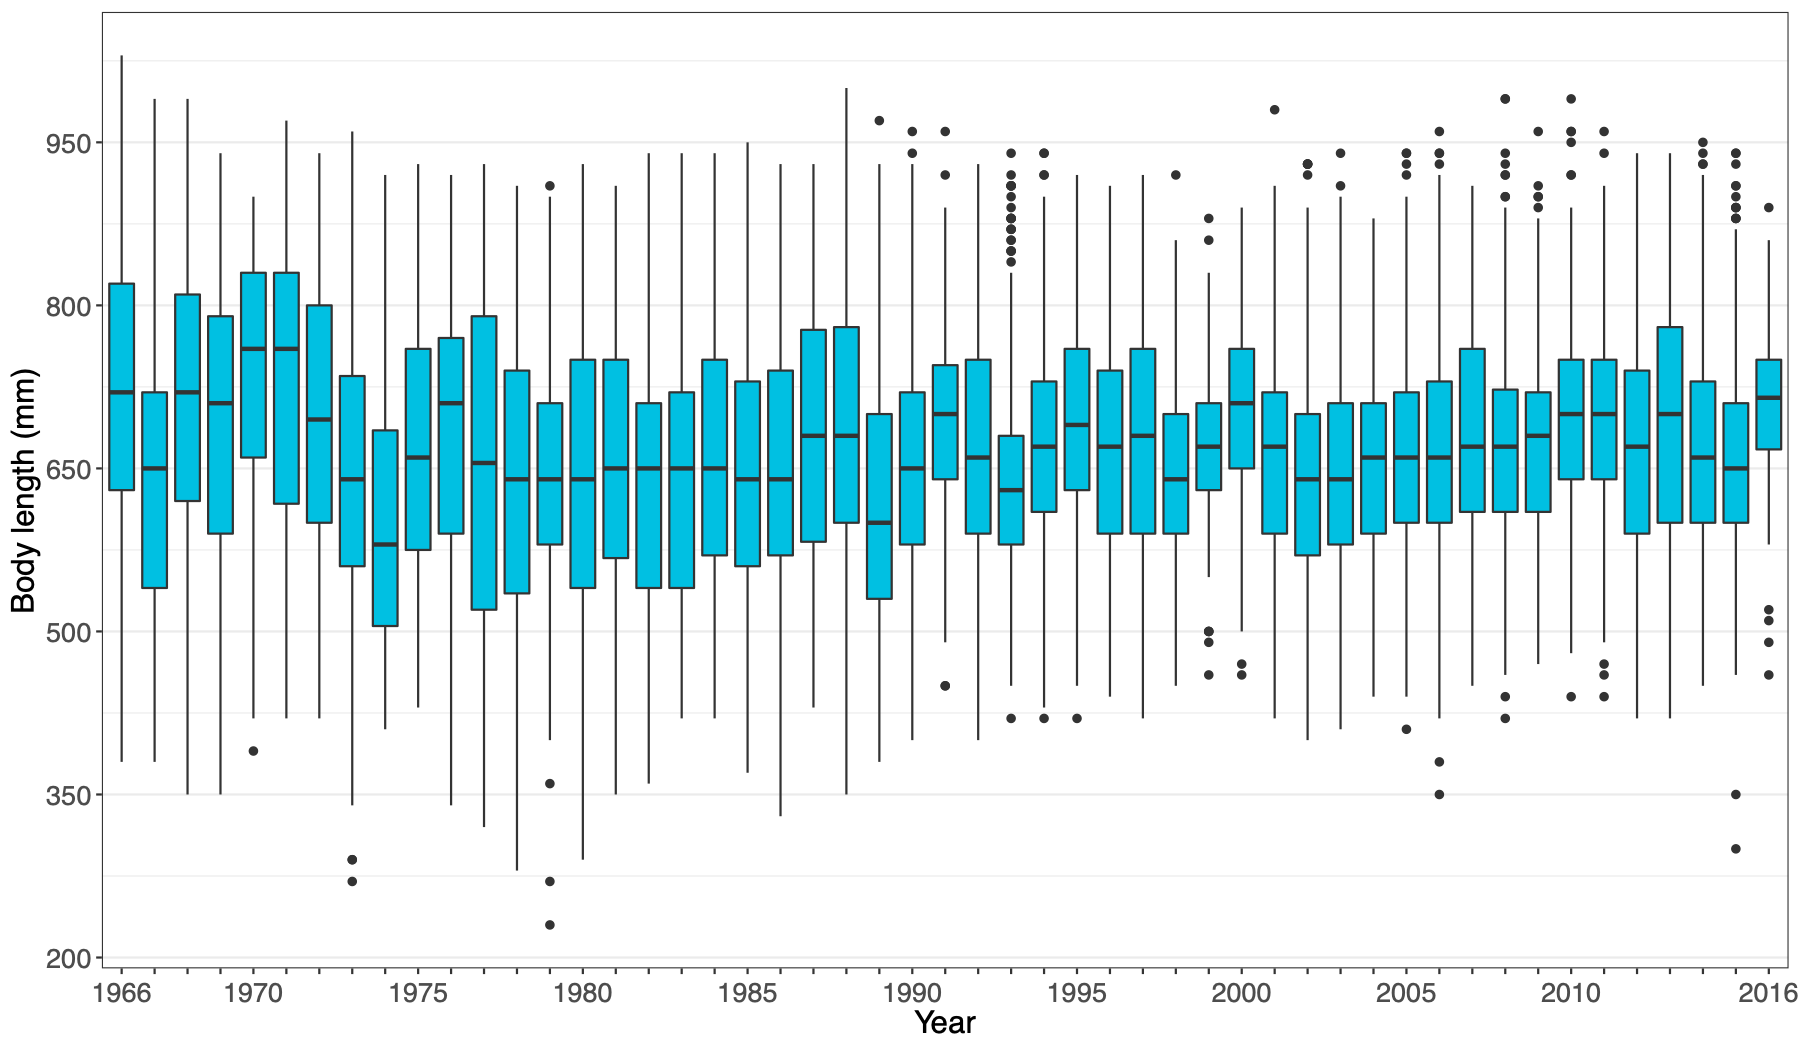
Annual distributions of individual body lengths measured upon capture in the fish ladder. The box plot shows the median (horizontal black bar), 25% and 75% quantiles (range of the box), largest and smallest values within 1.5 times the interquartile range (whiskers = vertical lines) and outliers (dots beyond whiskers).