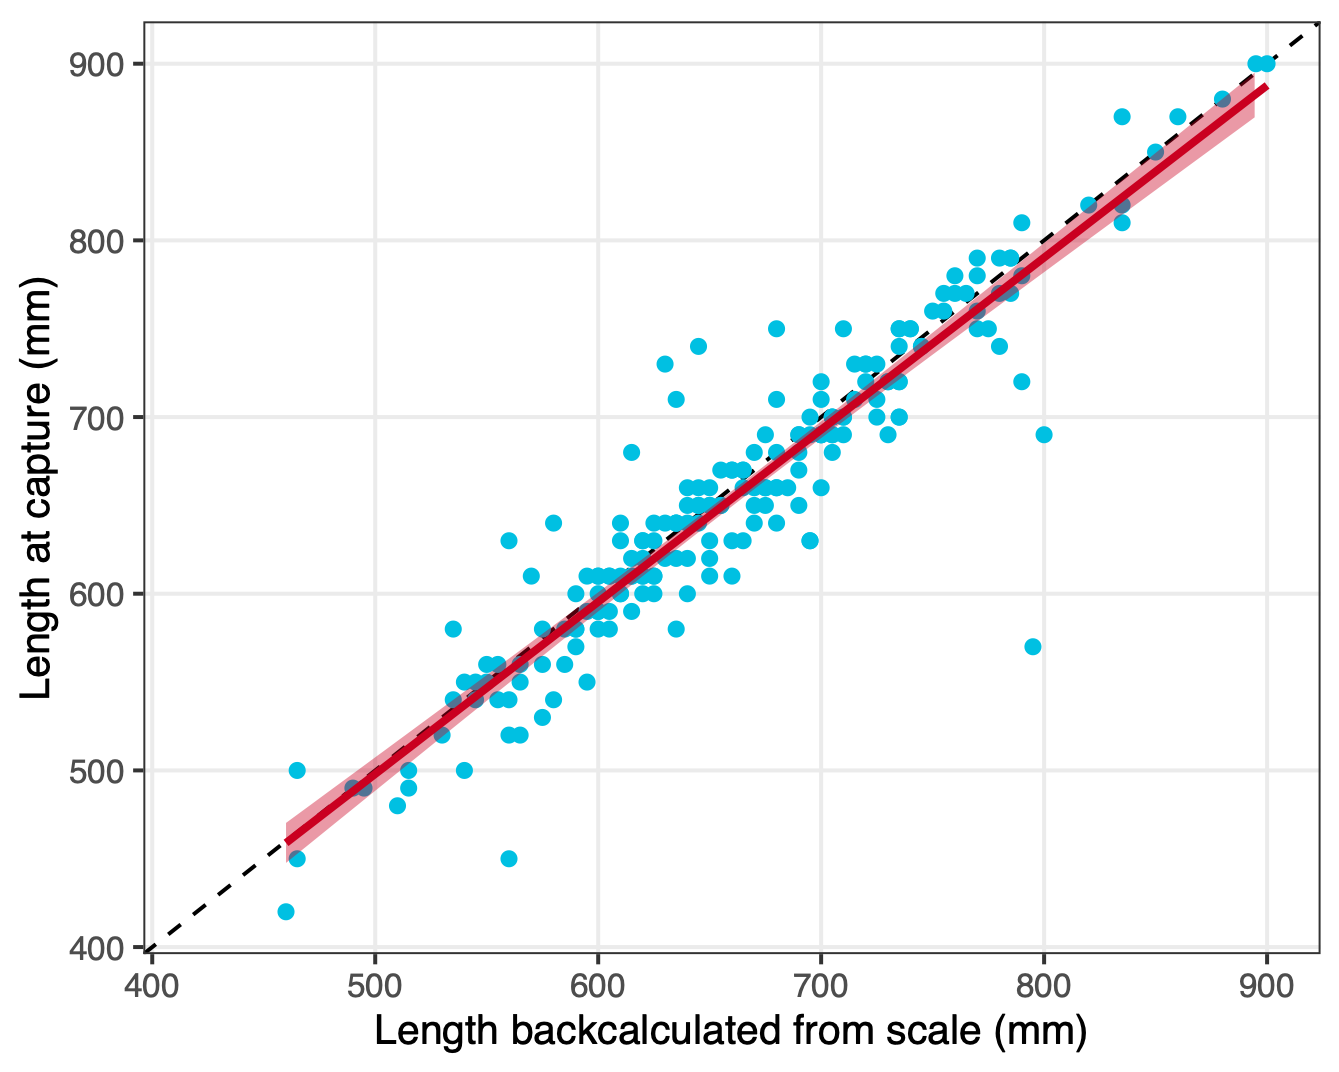
Correlation of backcalculated length from scales in spring (year t) and measured length in the fish ladder in autumn of the previous year (t-1). The blue dots represent data points (N = 201), the dashed line marks the 1-to-1 perfect correlation, and the red line is the fit of a linear regression including its confidence interval (intercept = 10.726, slope = 0.974, adj. R2 = 0.875).