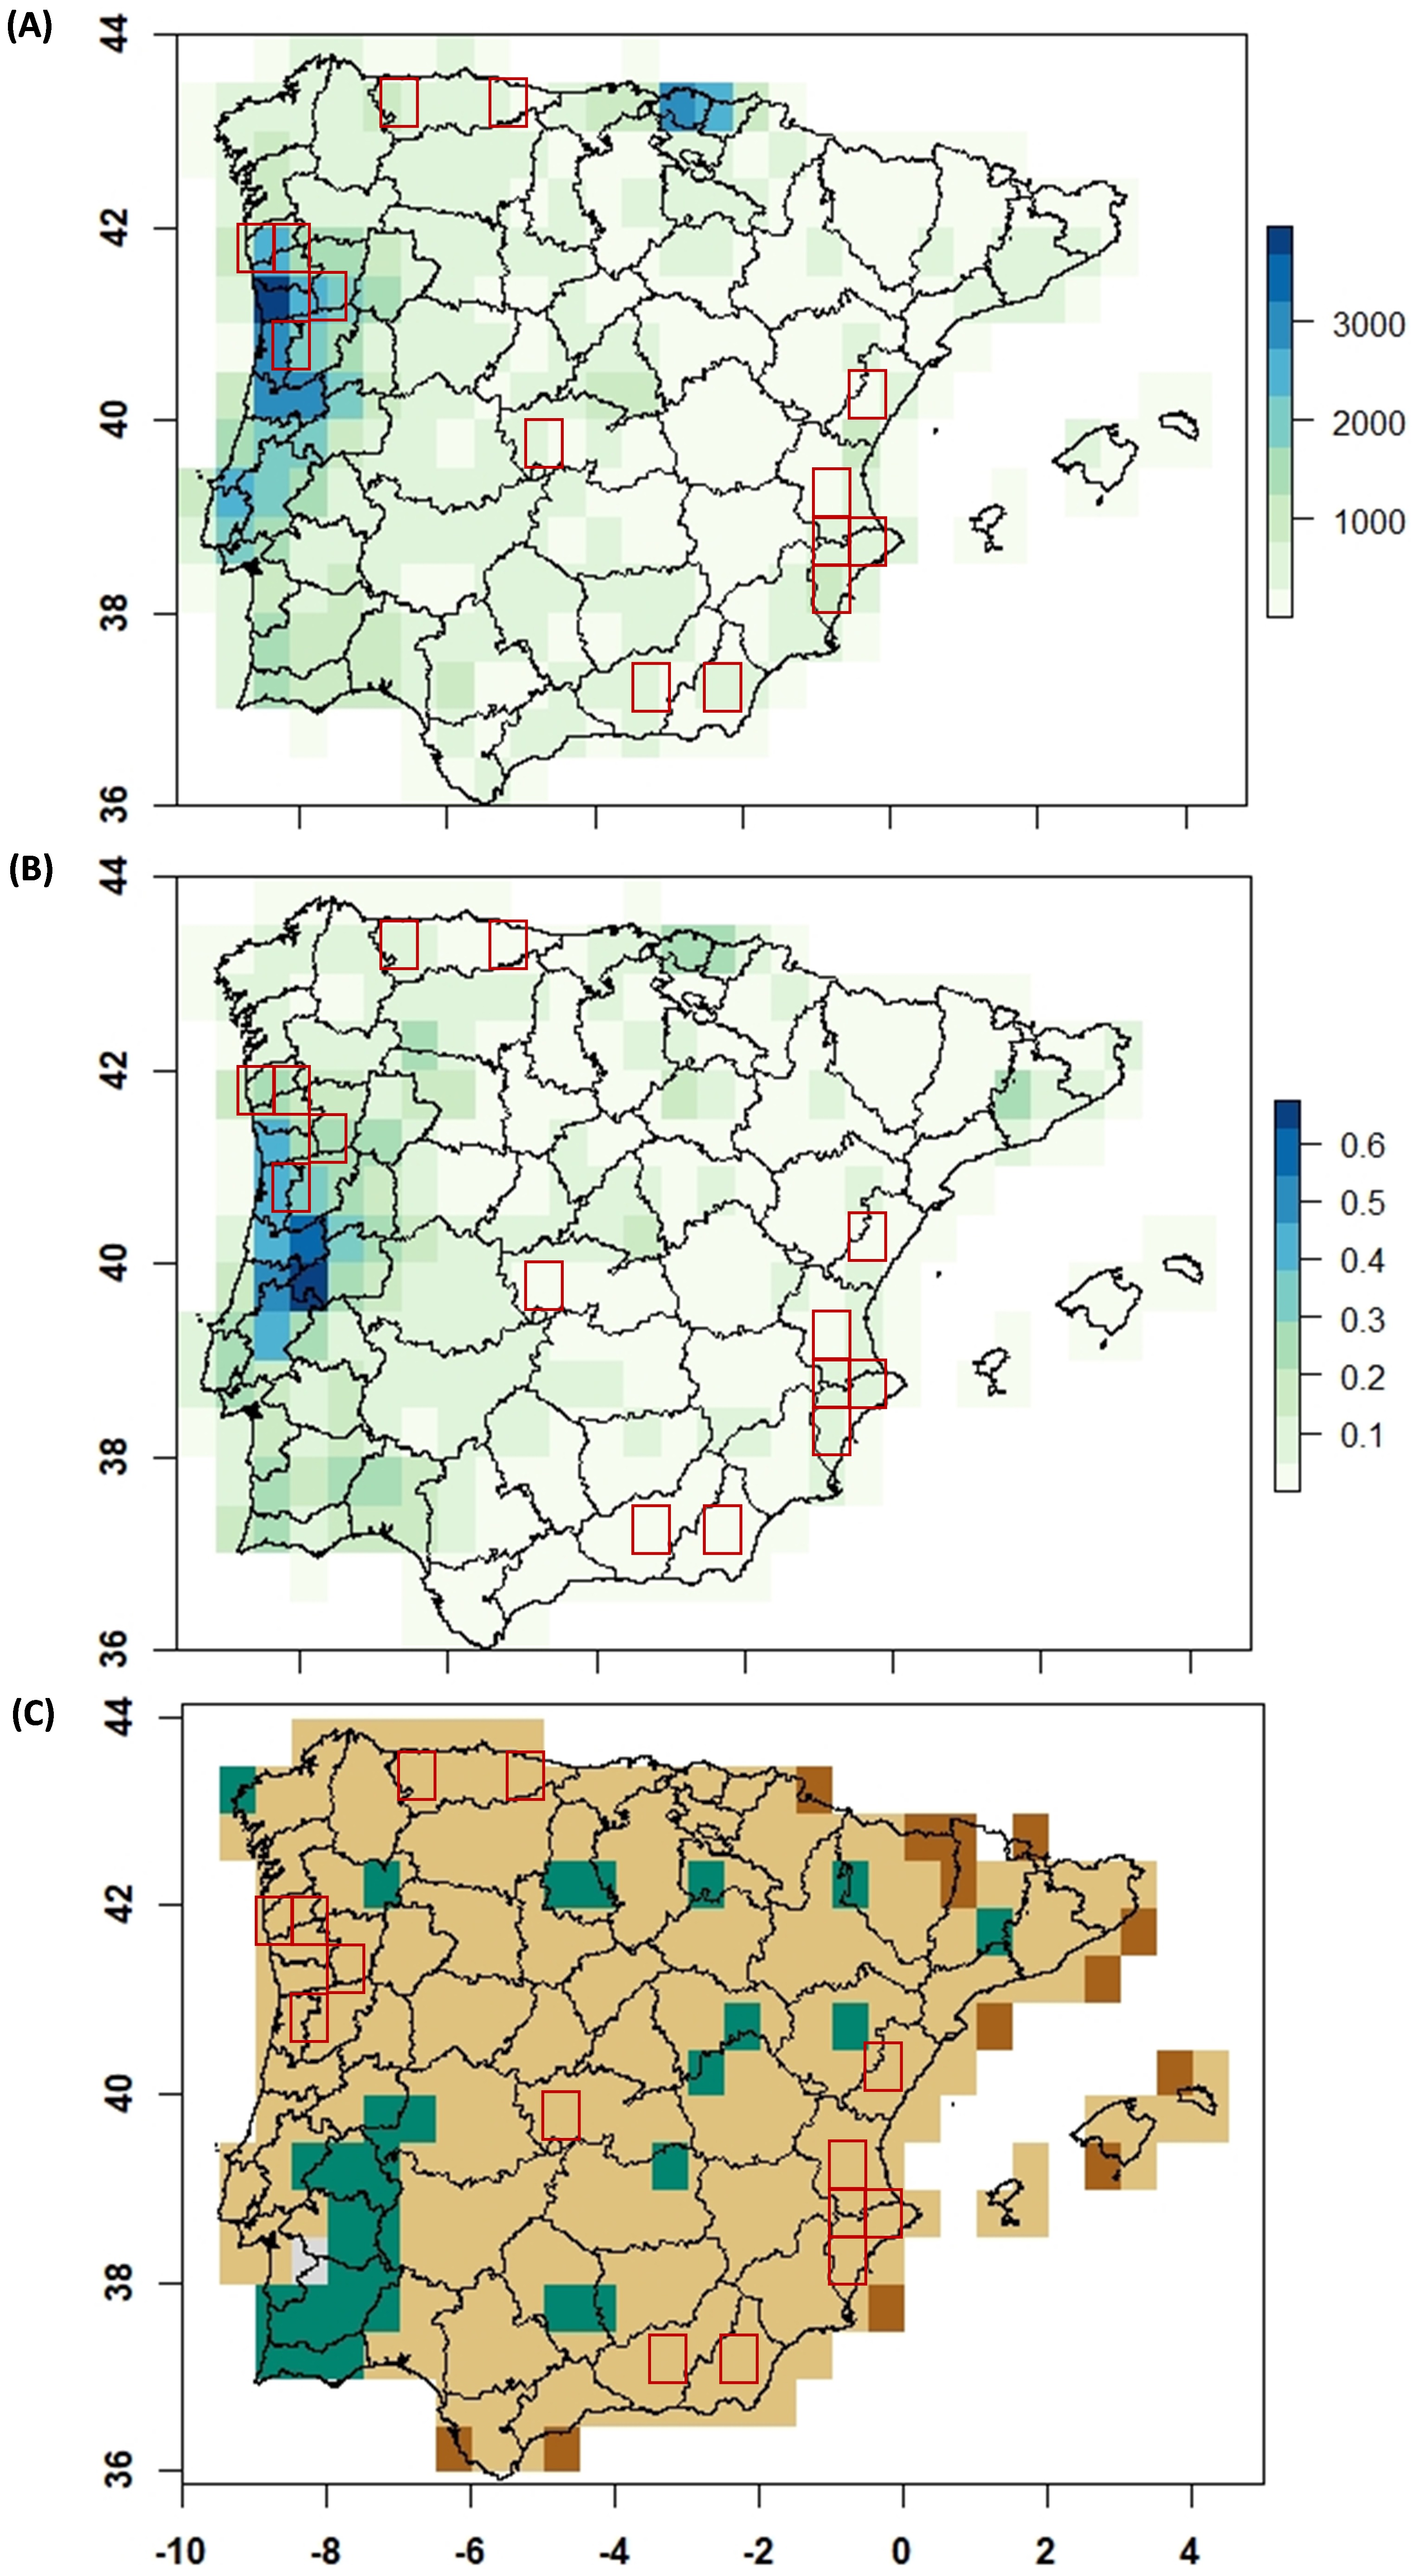
(A) Geographical distribution of frequency in land-use changes in 1990-2018 at 30’ resolution cells. (B) Proportion of land-use changed area in 1990-2018 at 30’ resolution cells. (C) Geographical distribution of ‘anthropised change ratio’ as artificial surfaces [A] or natural surfaces [N] changes. Dark brown cells ‘Anthropised only’ N to A; Light brown cells ‘Mostly anthropised’ N to A > A to N; Grey cells ‘Equally changed’ N to A = A to N; Green cells ‘Naturalised’ N to A < A to N. Red squares indicate the location of well-surveyed moss cells.