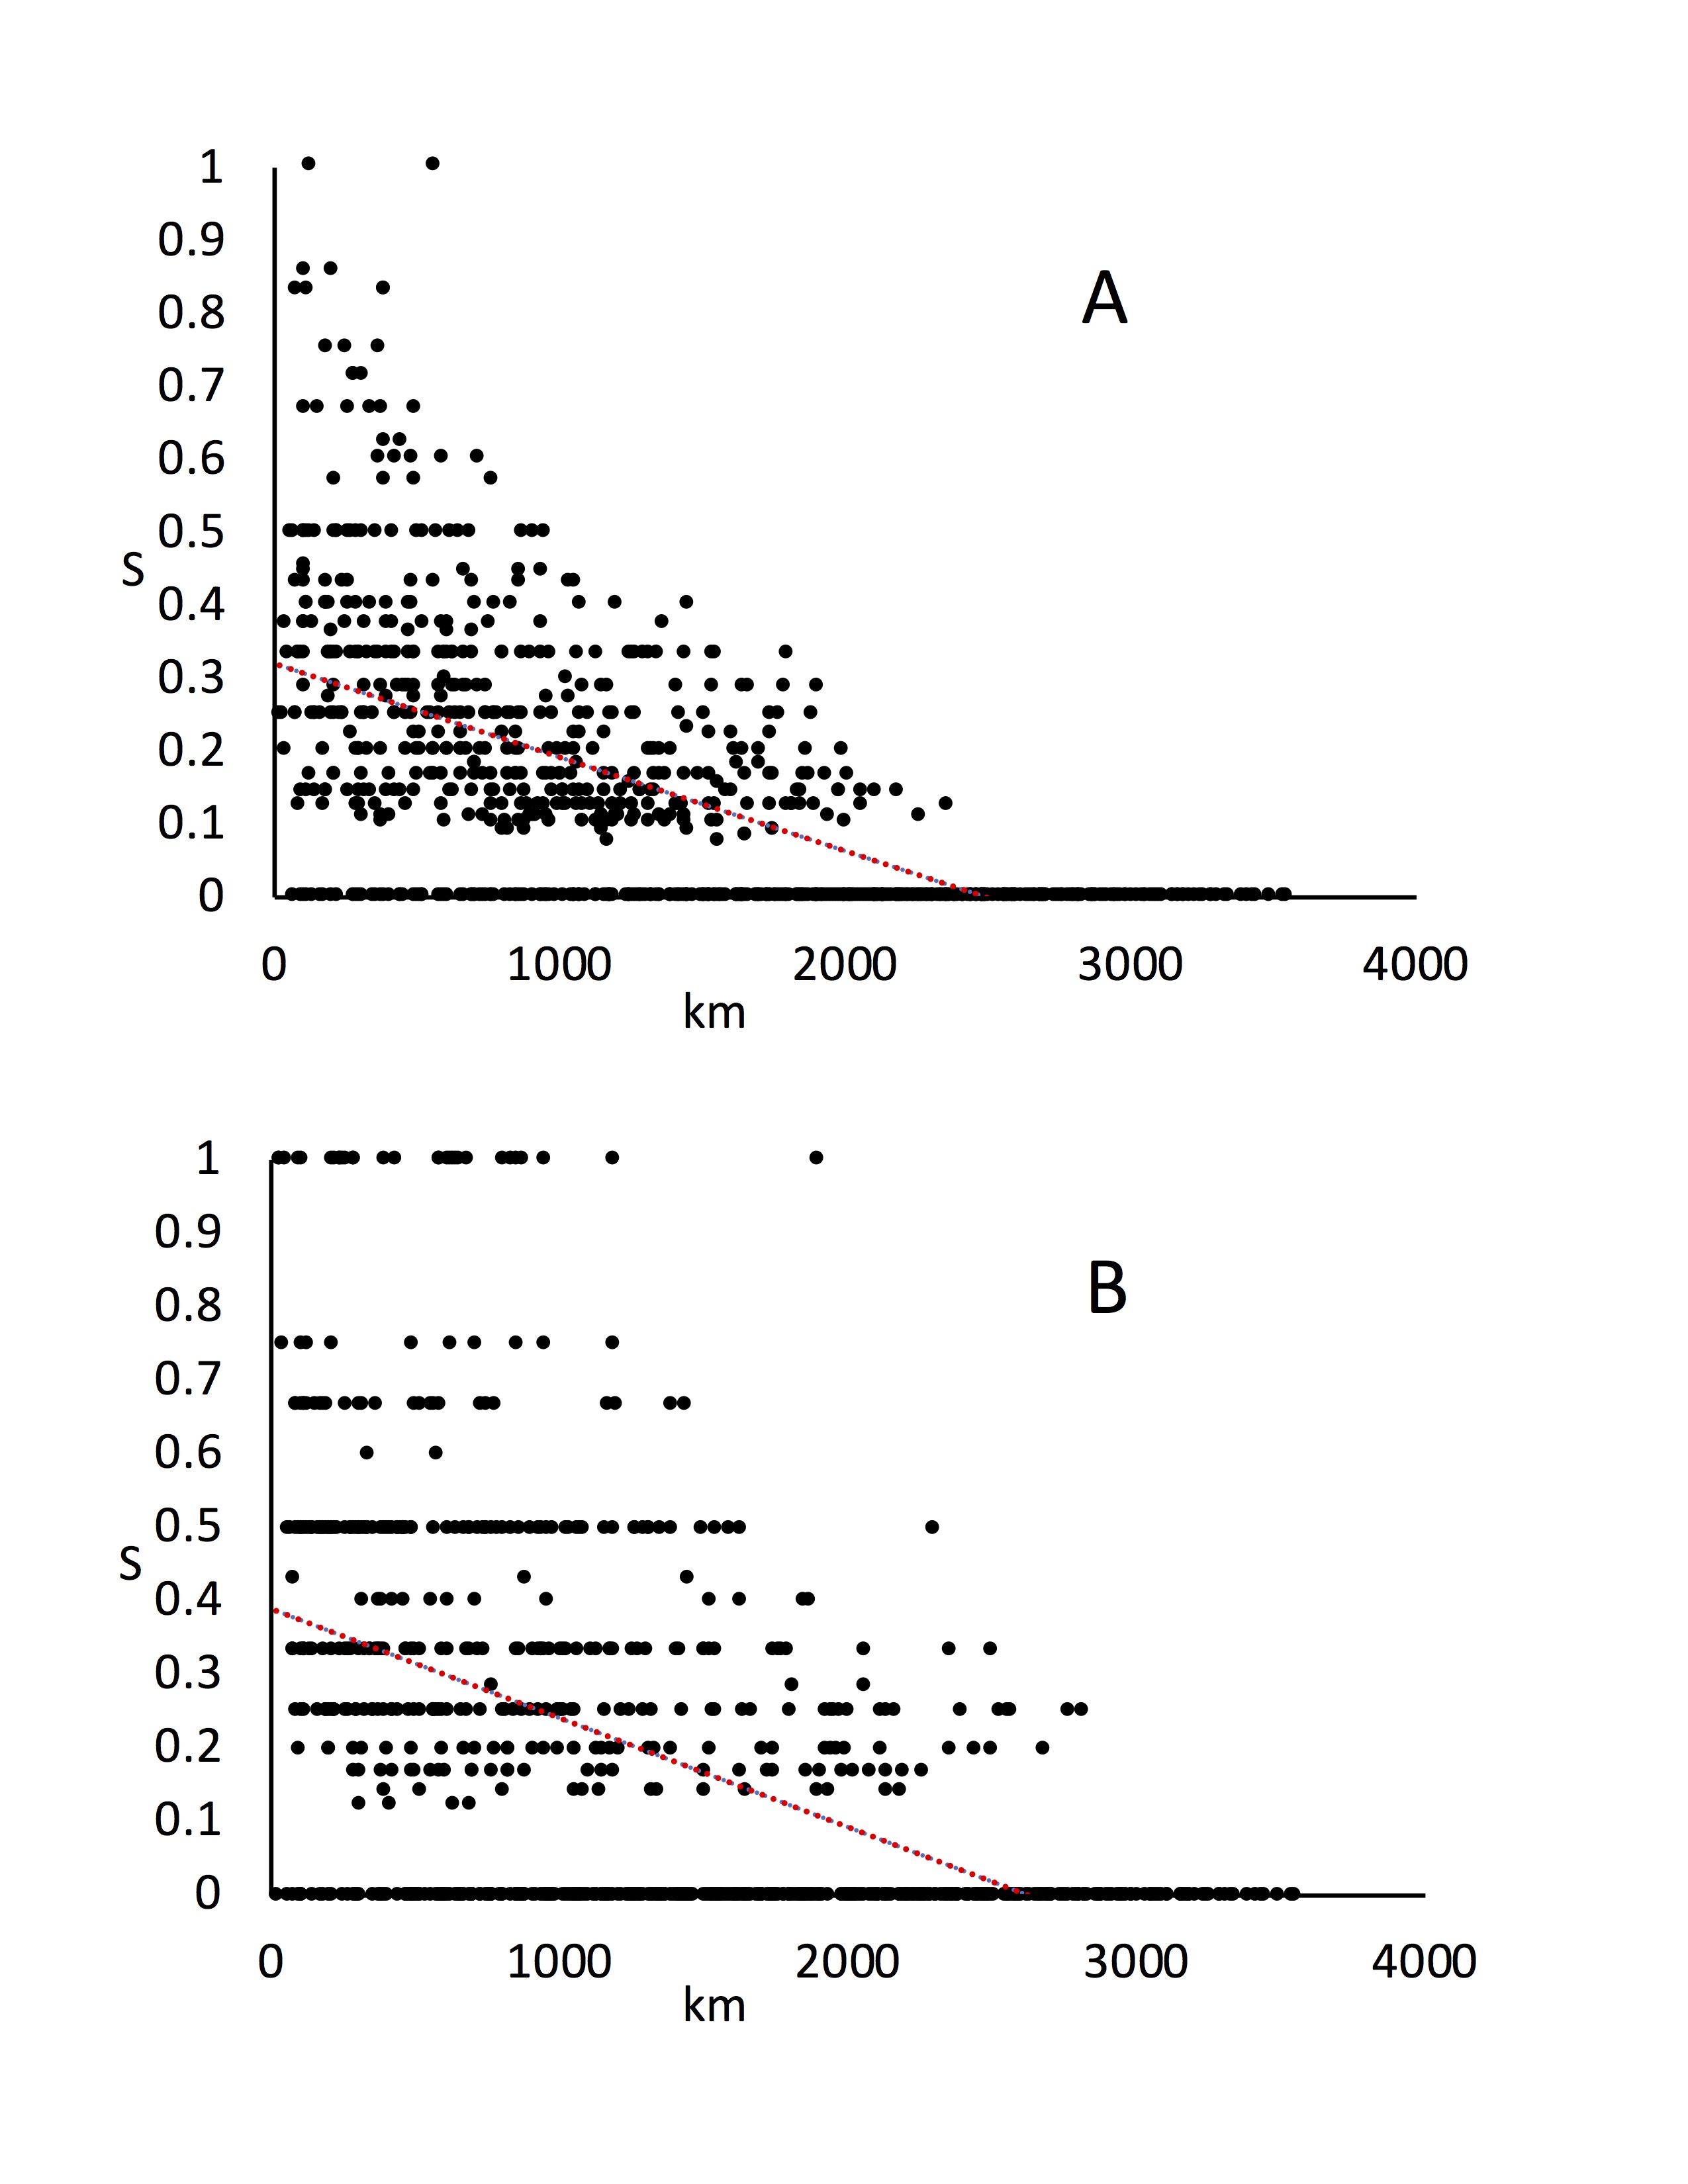
Similarity decay with distance (SDD) analysis. Plot of decreasing site similarity (Jaccard similarity coefficient, based on: A = willows; B = psyllids) with geographical distance (km). The red trendline shows the linear regression. The patterns show similar gross geographical patterning between willows and psyllids.