|
|
||
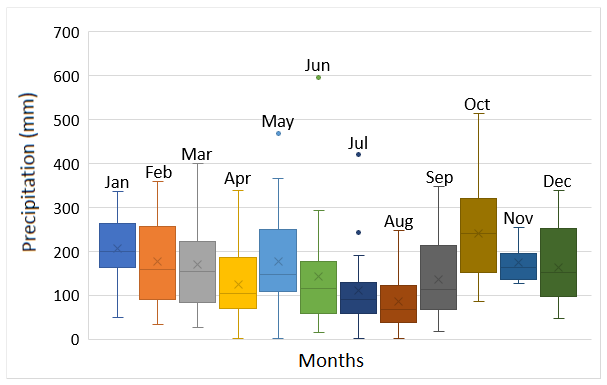
| Monthly precipitation: Horizontal line indicates the median, x represents the average, the box includes 50% of the data, from the 25th to the 75th percentile, the vertical lines extend to the 10th and 90th percentiles and the circles are extremes values. Data refer to the period from January 2000 to December 2019. Source: AGUASPARANÁ. | ||
| Part of: Santos JS, Wolff LL, Baldan LT, Guimarães ATB (2020) Seasonal records of benthic macroinvertebrates in a stream on the eastern edge of the Iguaçu National Park, Brazil. Biodiversity Data Journal 8: e54754. https://doi.org/10.3897/BDJ.8.e54754 |