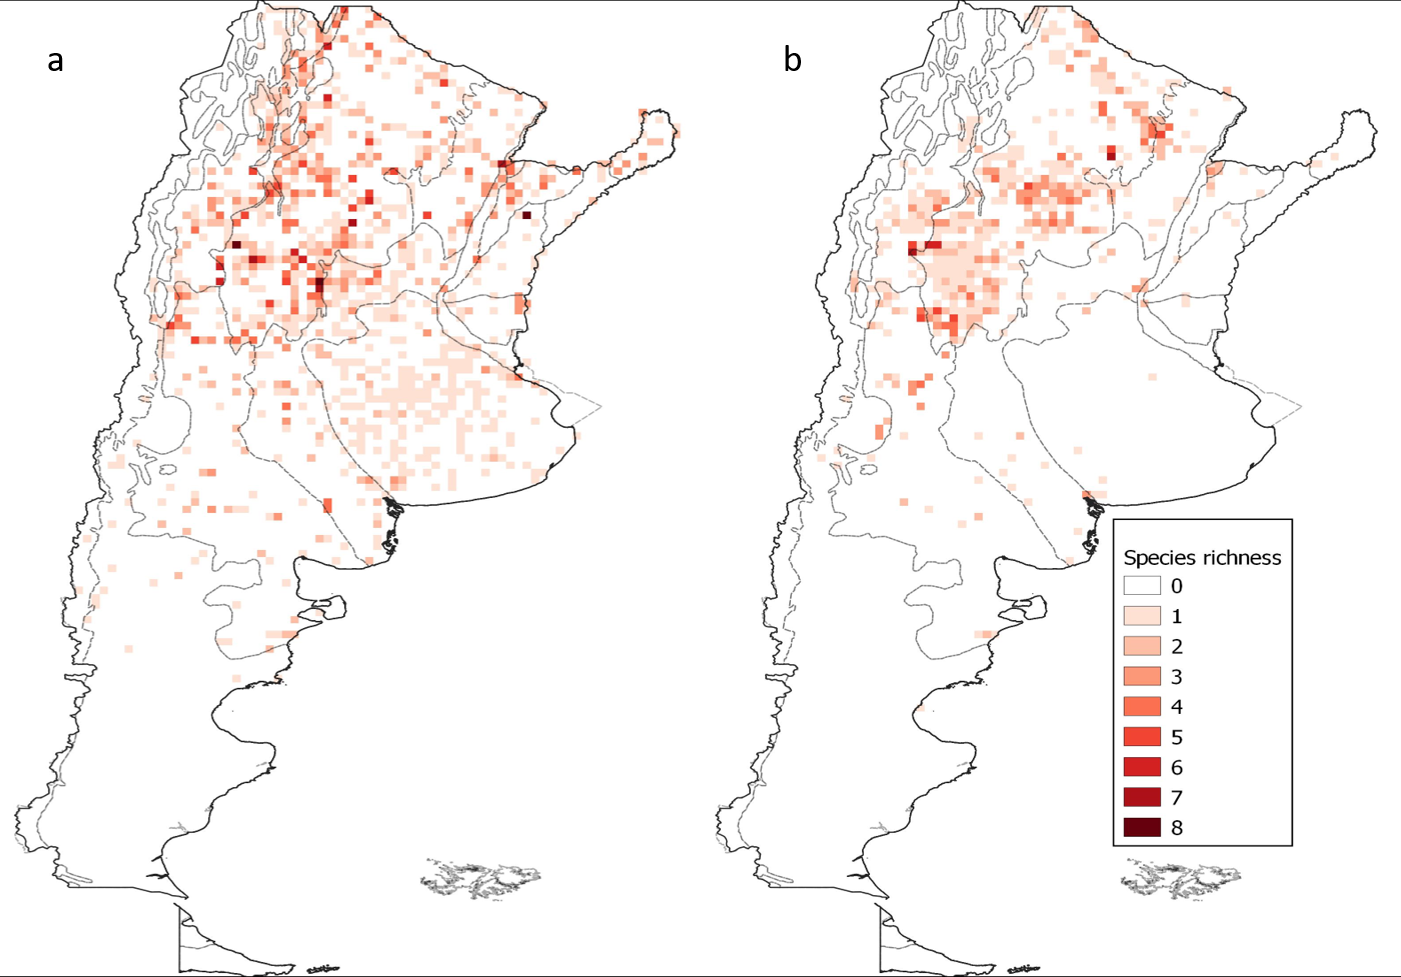
Spatial pattern of Argentinean triatomine species richness. (a) pre-2000 occurrence data and (b) post-2000 occurrence data. The colour gradient corresponds to the number of species present in each cell. Dashed lines indicate limits between ecoregions.

 
  Part of: Ceccarelli S, Balsalobre A, Cano ME, Canale D, Lobbia P, Stariolo R, Rabinovich JE, Marti GA (2020) Analysis of Chagas disease vectors occurrence data: the Argentinean triatomine species database. Biodiversity Data Journal 8: e58076. https://doi.org/10.3897/BDJ.8.e58076