Comparisons of non-metric multidimensional scaling (nMDS) plots in BinMat (A1 and B1) and PAST (A2 and B2). Both nMDS plots are plotted for k = 2 dimensions. Data were taken from
|
|
||
|
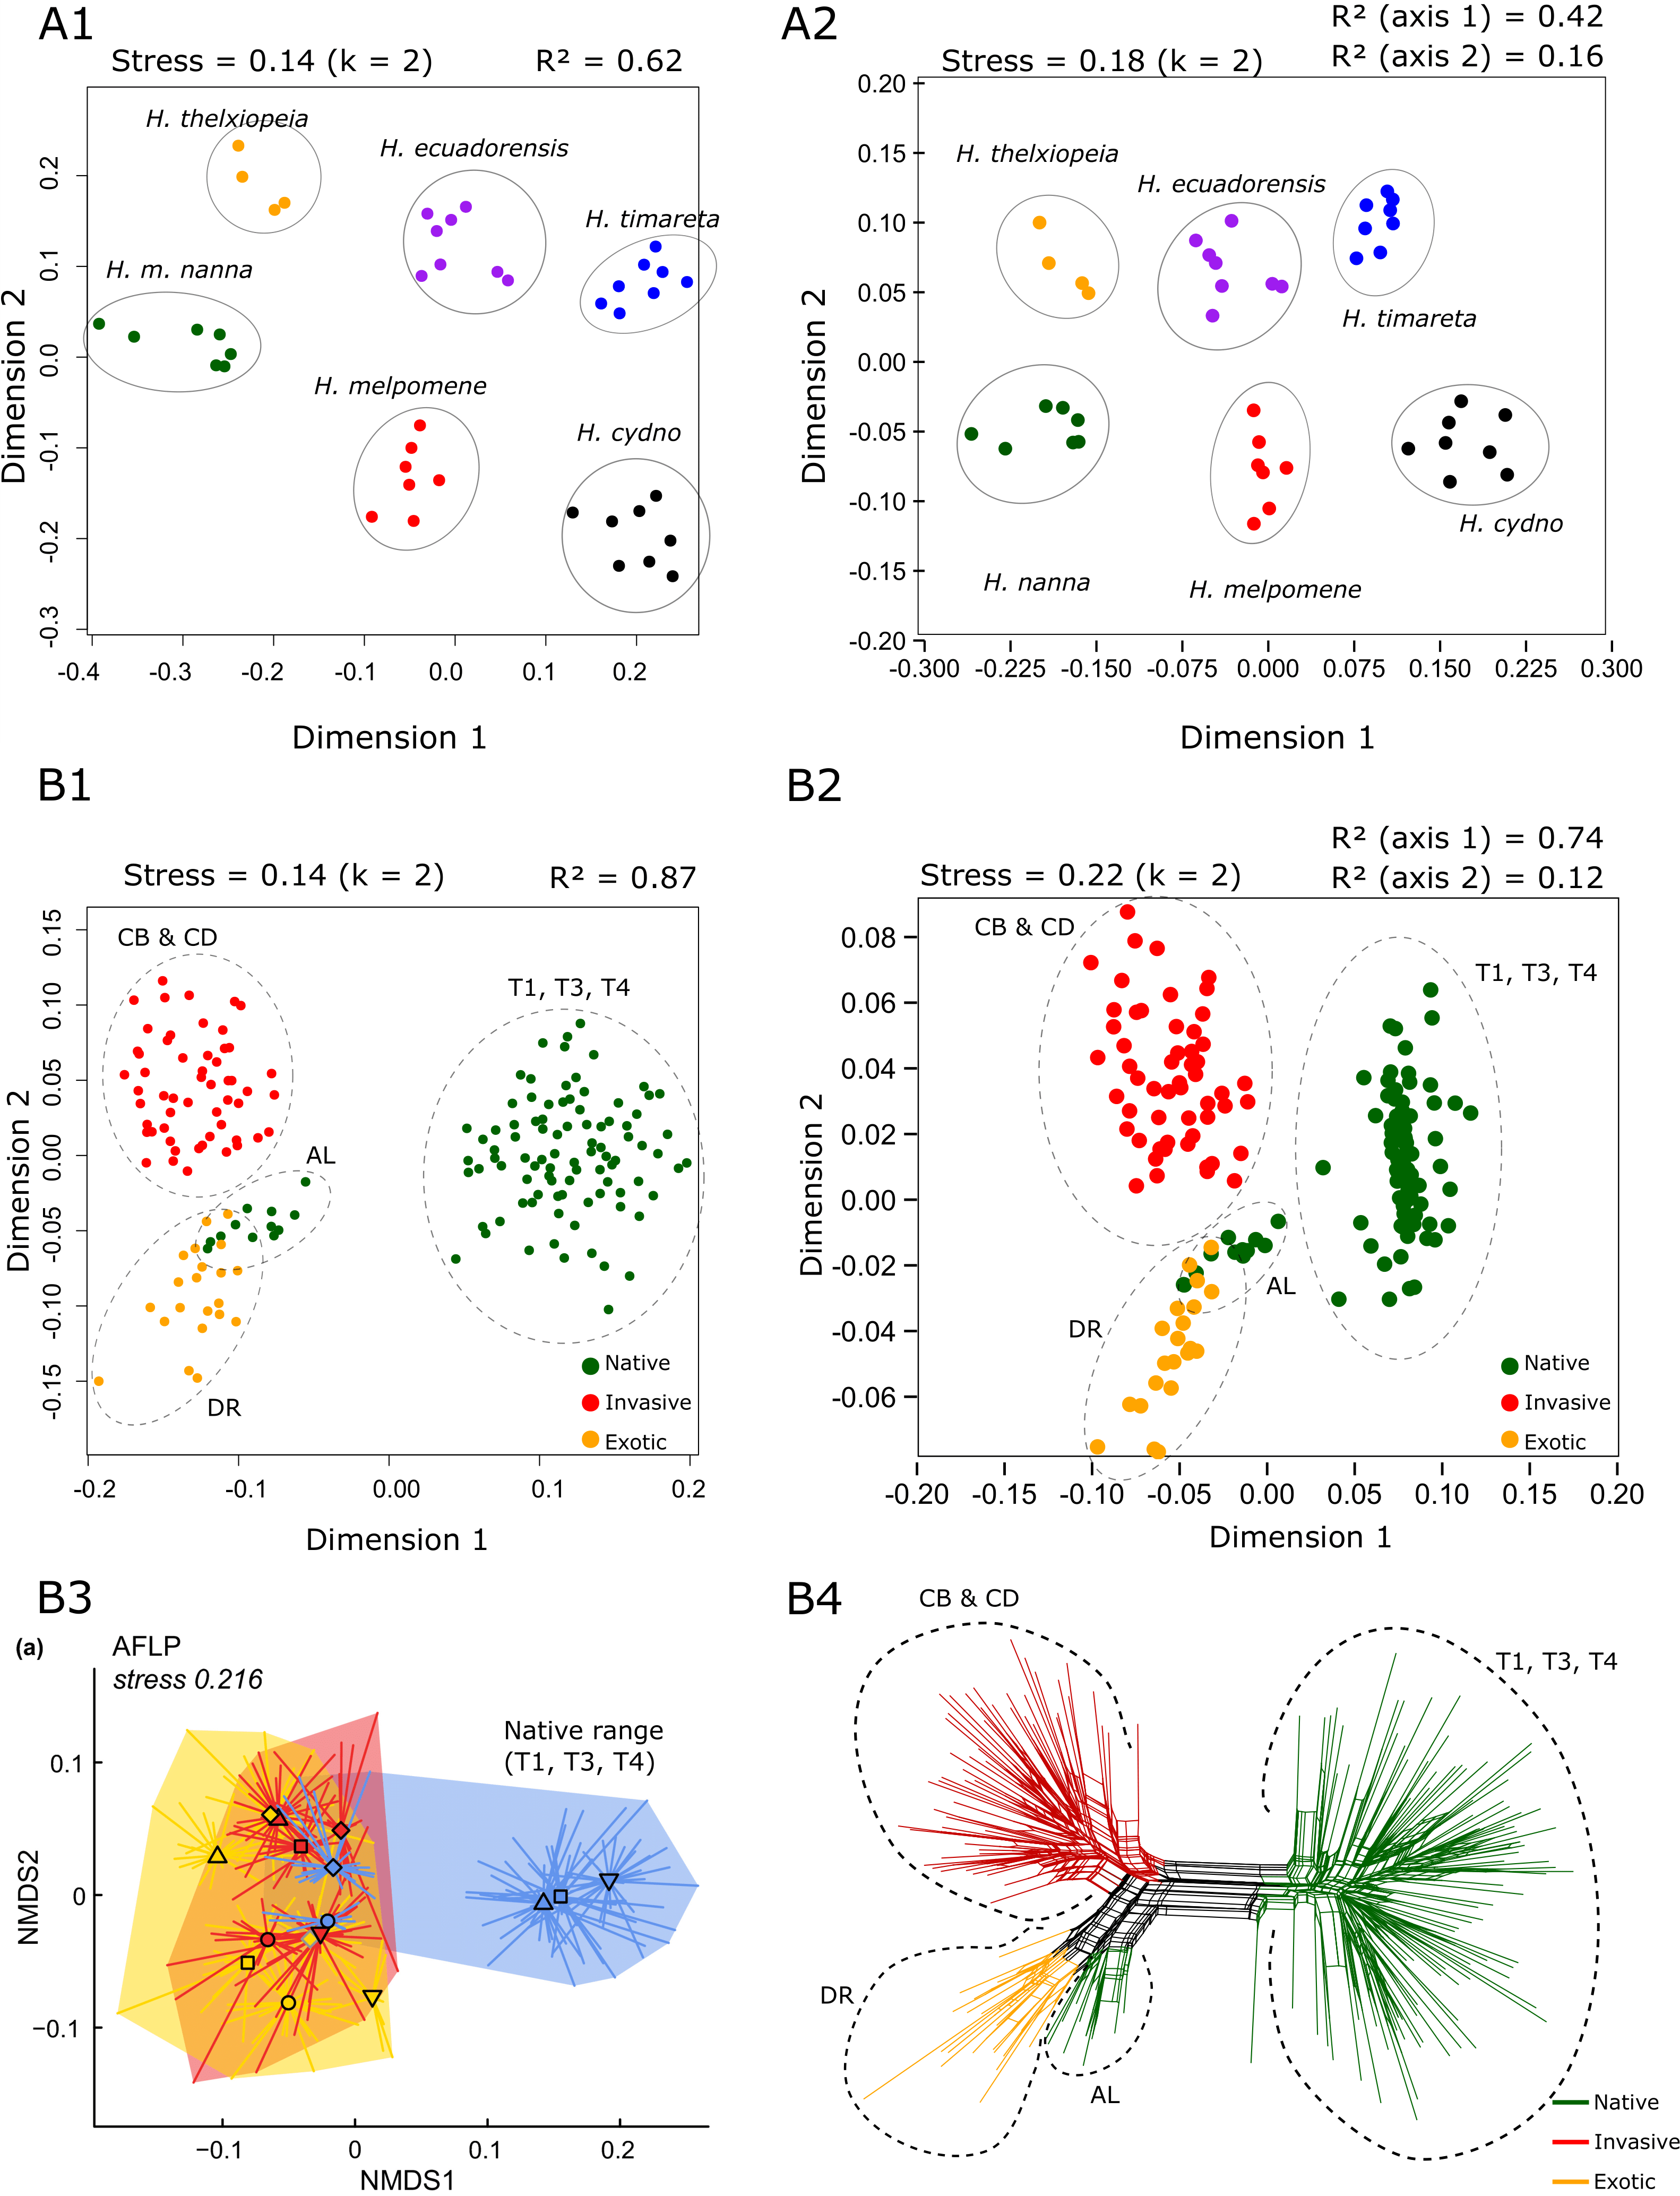
Comparisons of non-metric multidimensional scaling (nMDS) plots in BinMat (A1 and B1) and PAST (A2 and B2). Both nMDS plots are plotted for k = 2 dimensions. Data were taken from |
||
| Part of: van Steenderen C (2022) BinMat: A molecular genetics tool for processing binary data obtained from fragment analysis in R. Biodiversity Data Journal 10: e77875. https://doi.org/10.3897/BDJ.10.e77875 |