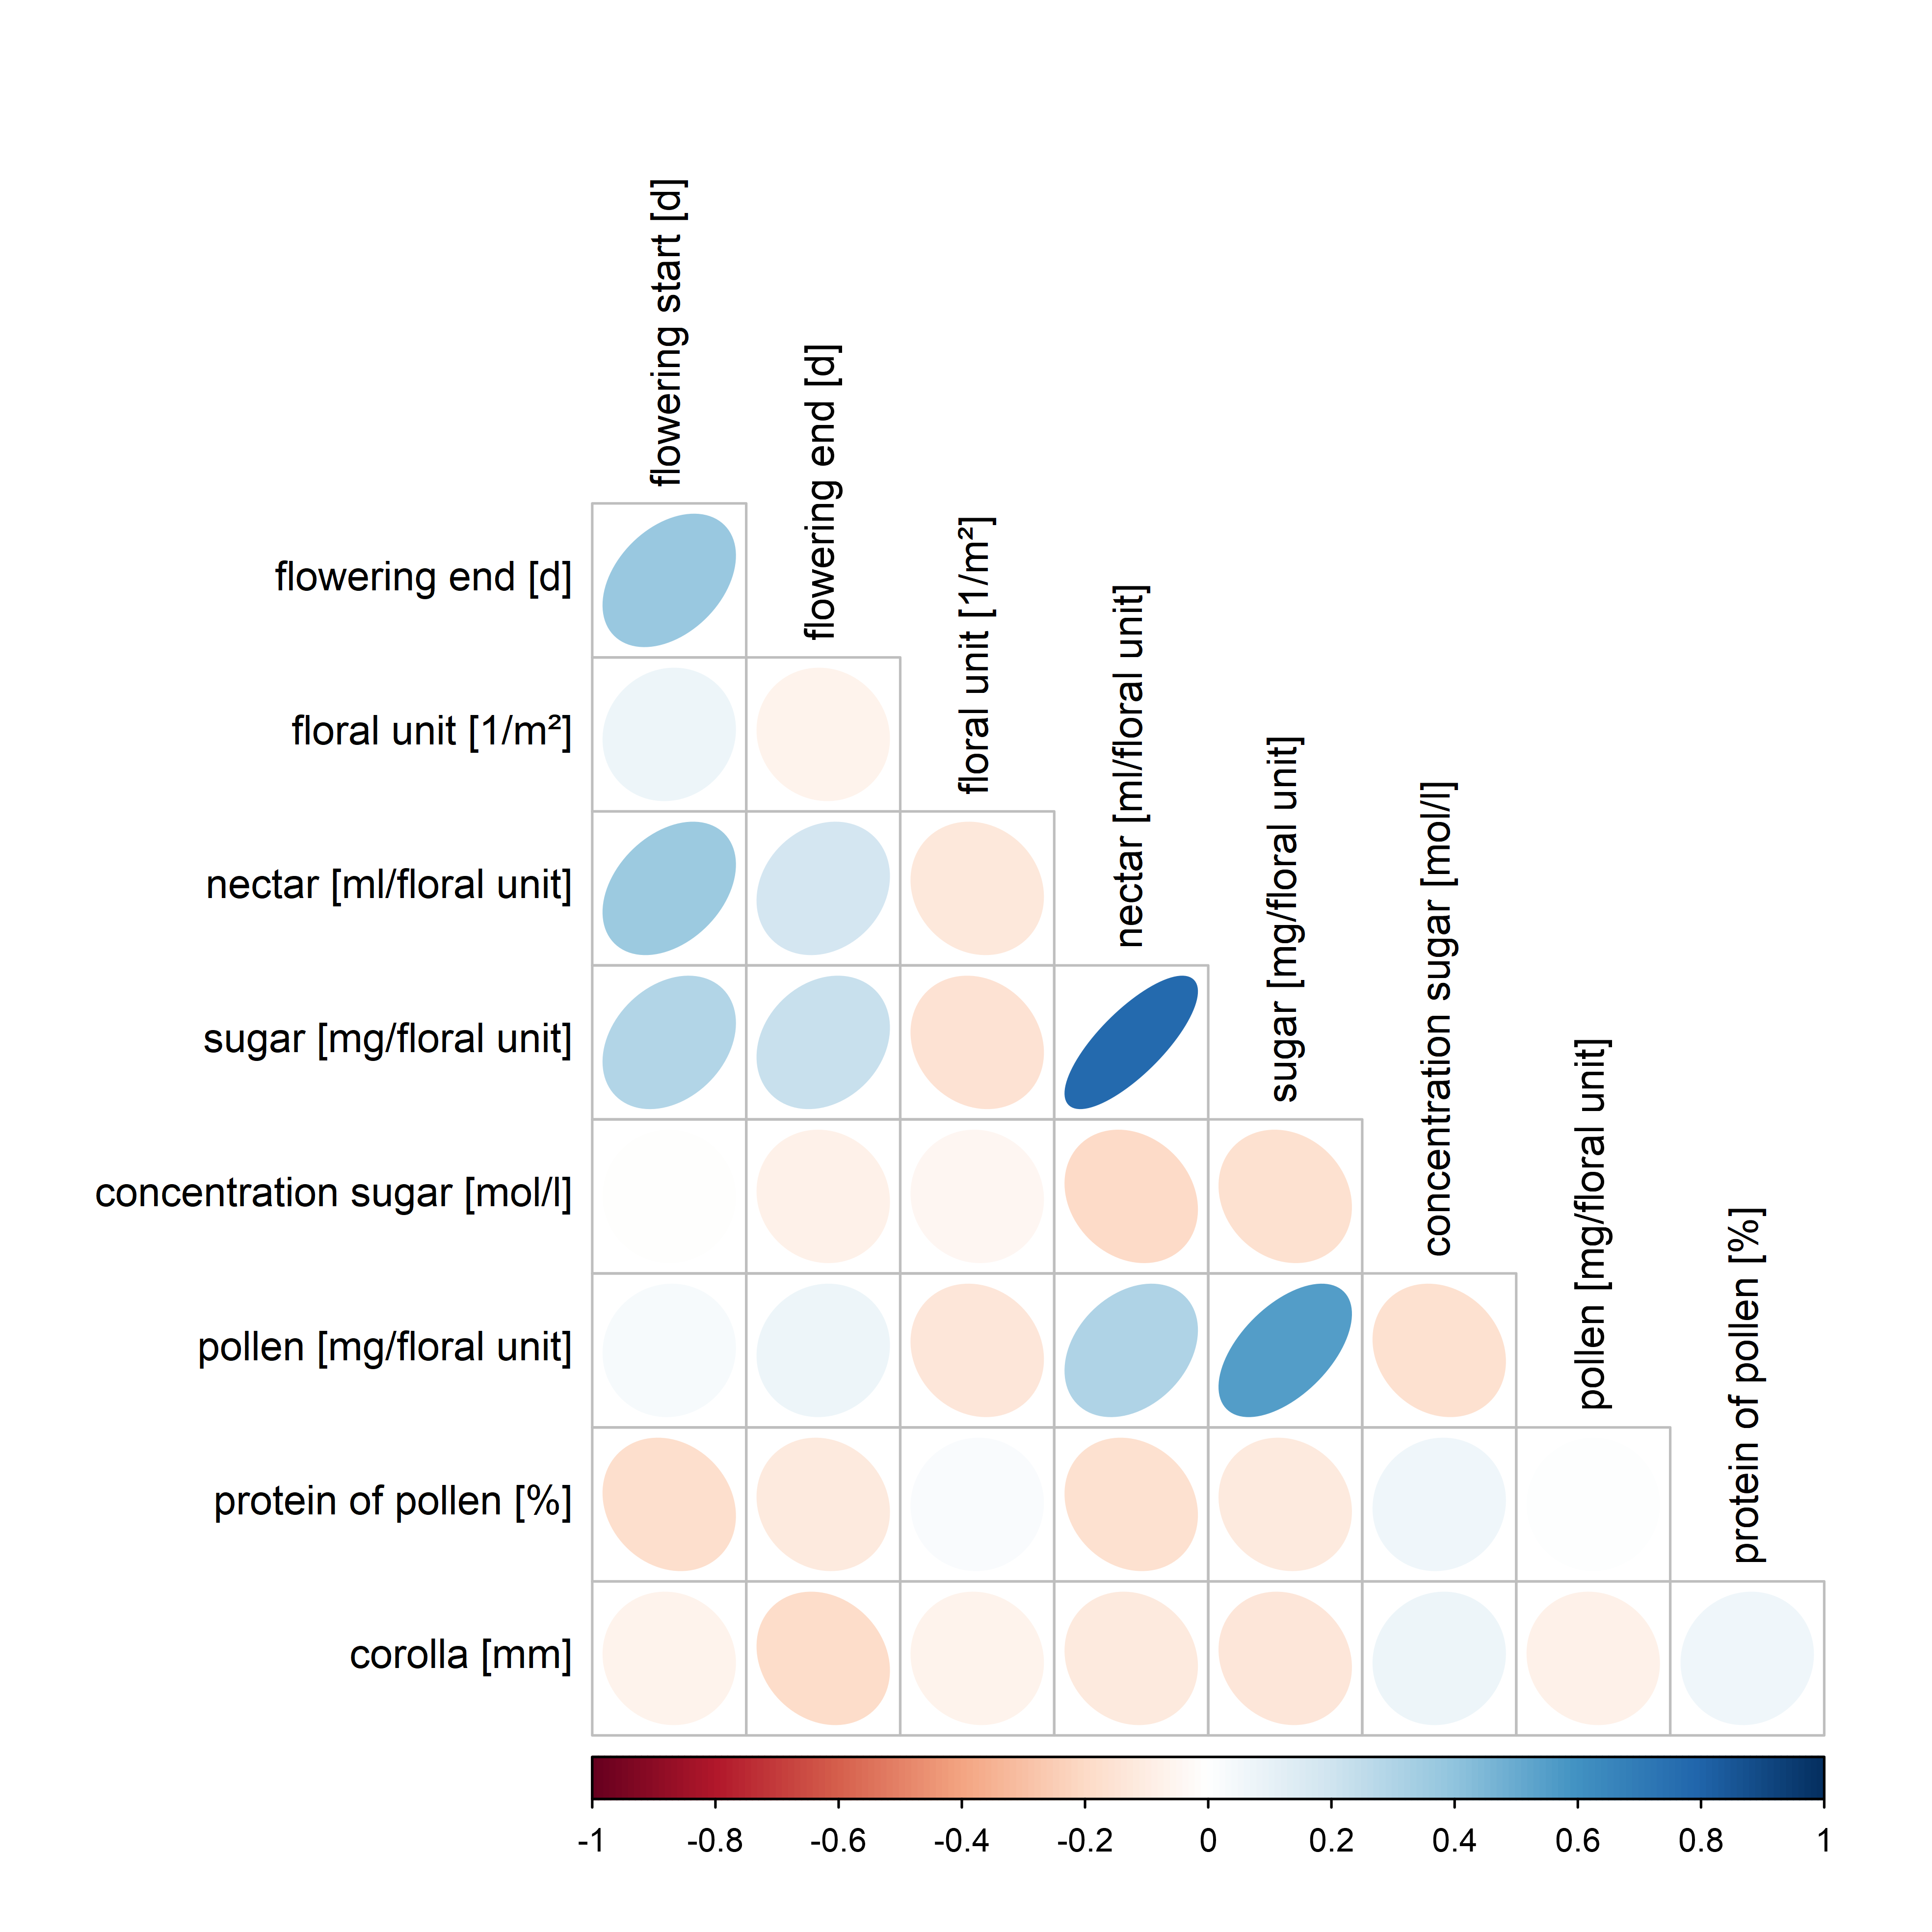
Pearson coefficient correlations between the species’ traits. Red colour scale (-1 to 0) indicates negative linear correlation and blue colour scale (0 to 1) positive linear correlation between two traits. White indicates no linear correlation (0) between two traits. The stronger the relationship, the darker the colour and the circle shape becomes more and more elliptical.