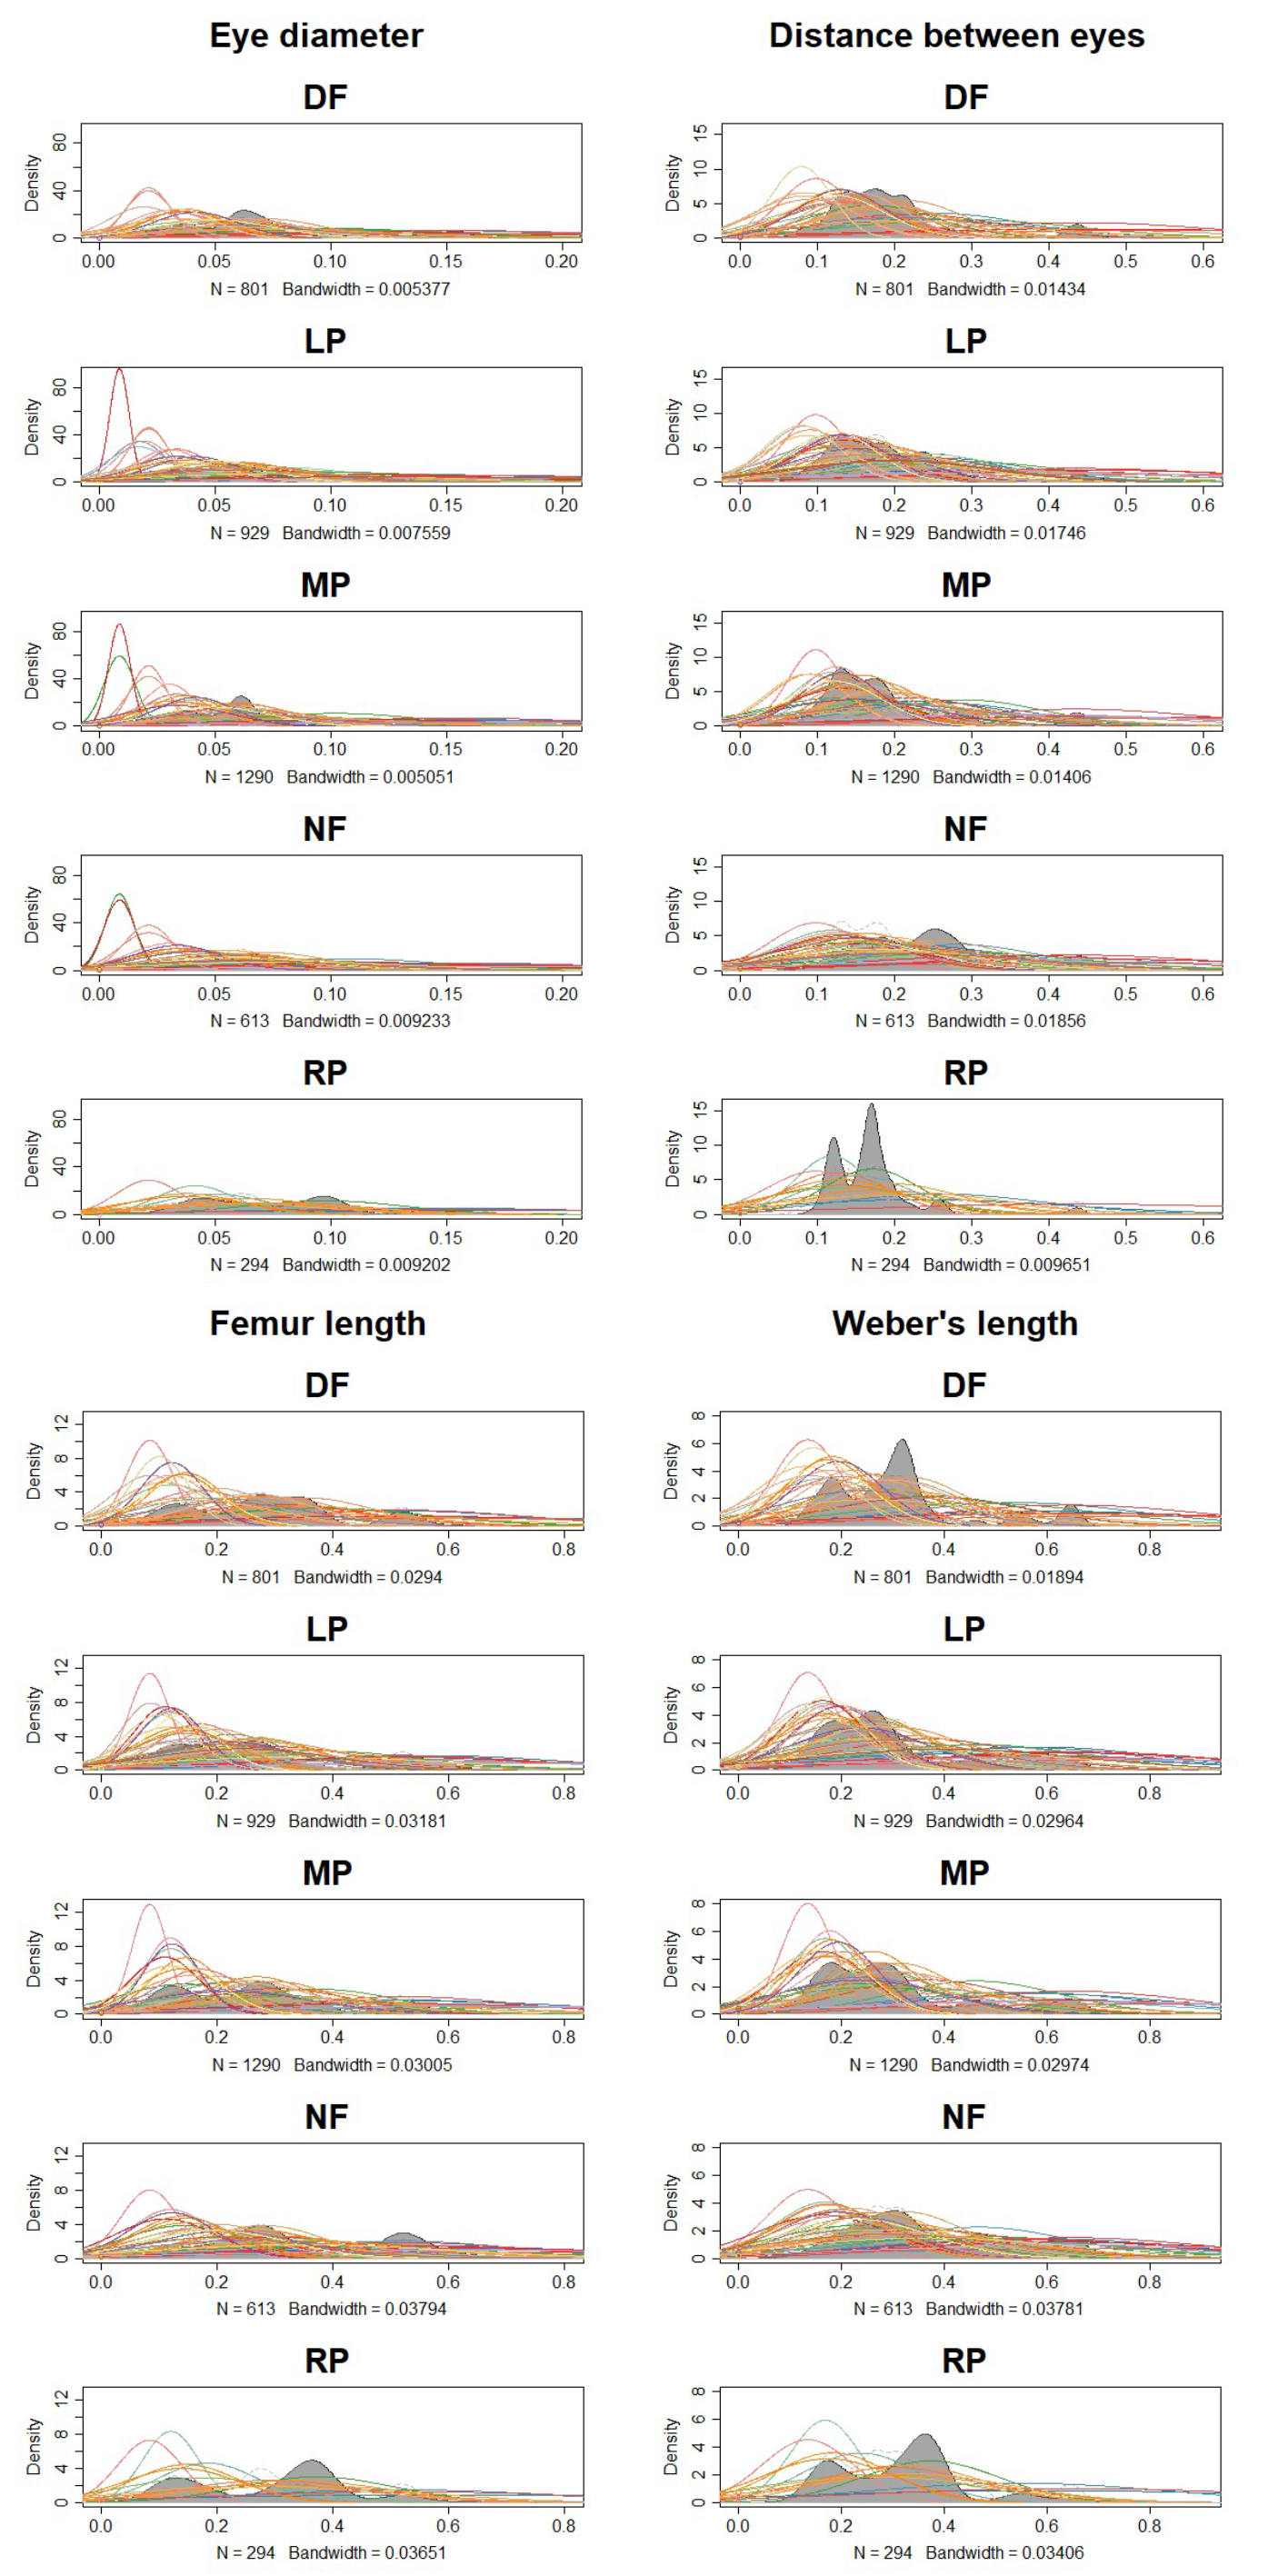
Kernel density plot of ant mean species’ traits amongst different sites. Graph created with plotDistri function from cati packages of R, which computes kernel density estimates. Secondary forest (NF), lac plantation (LP), lac plantation - corn agroforest (MP), dryland farm (DF) and rice paddy (RP). Grey contour lines represent trait kernel density and every coloured line represents an ant species.