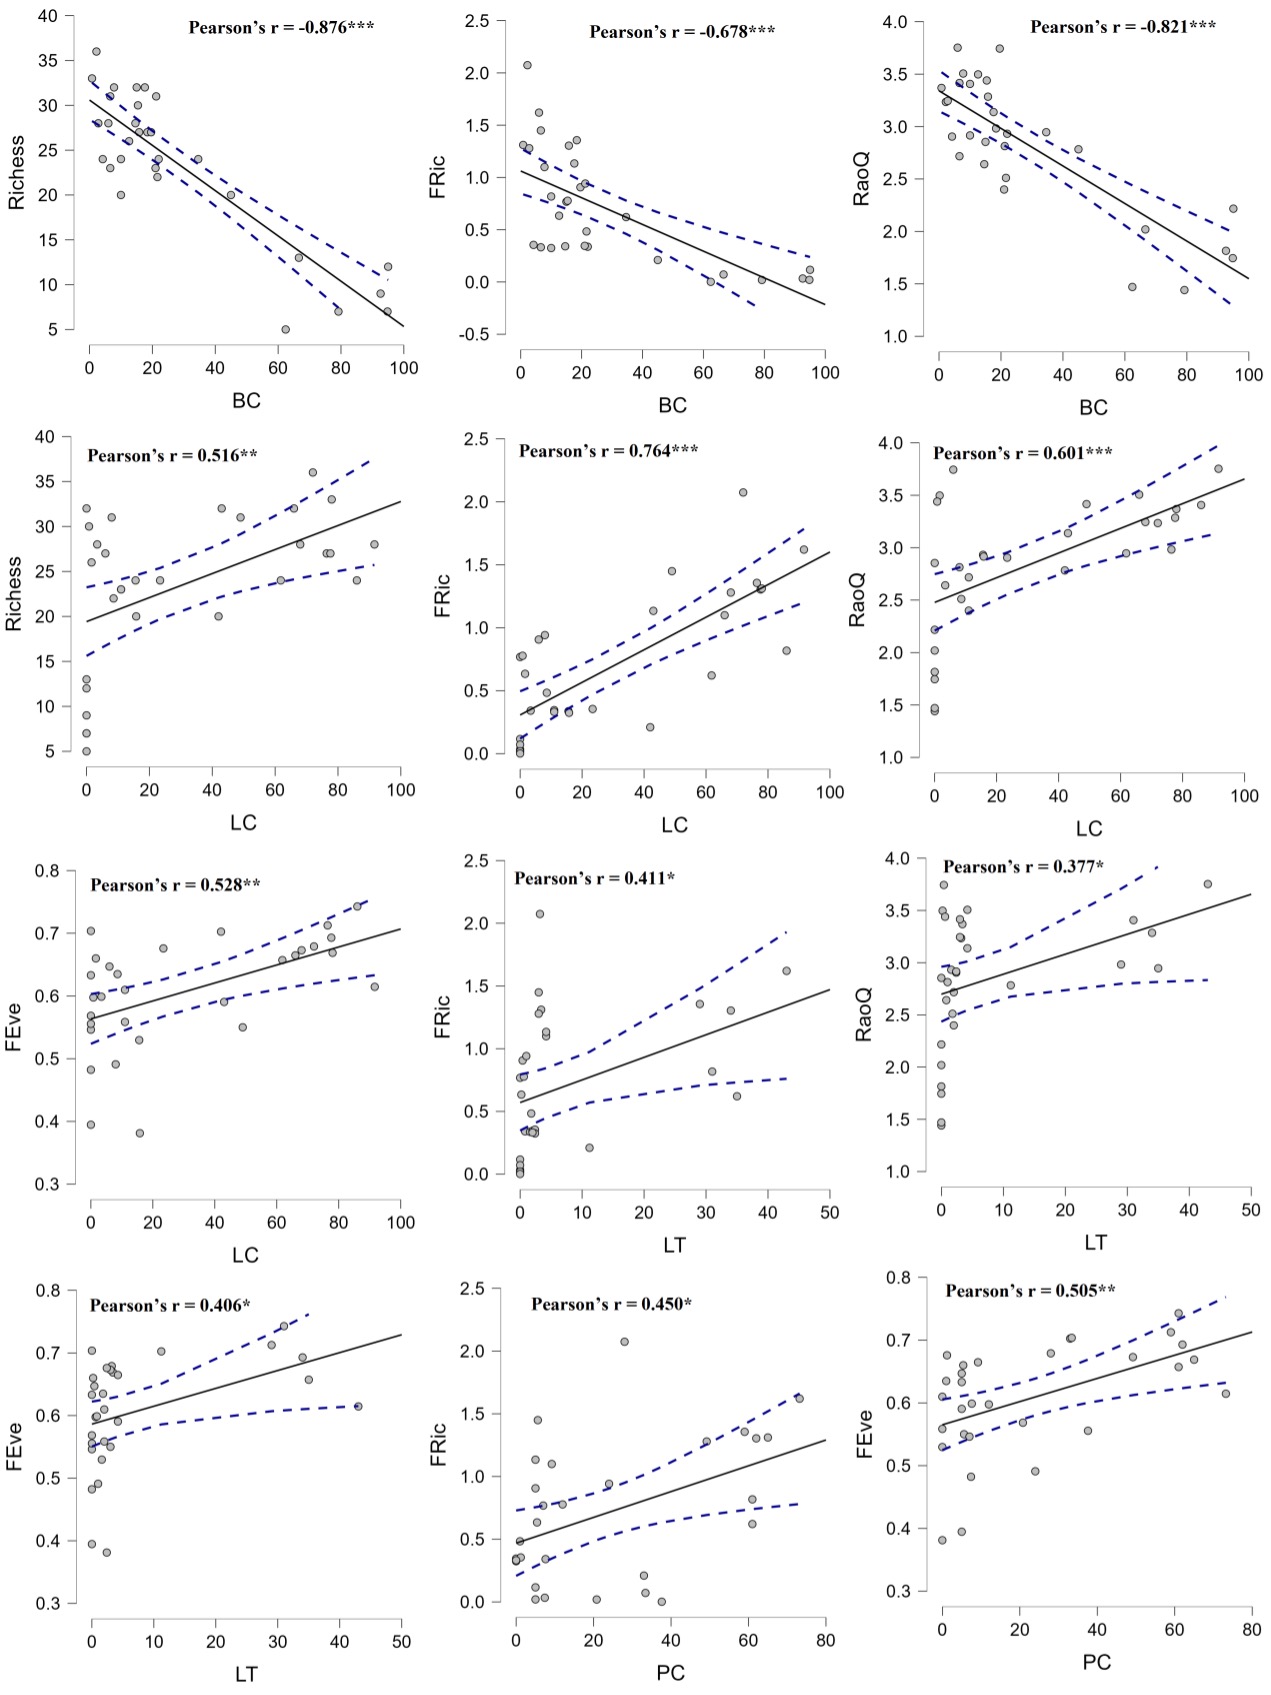
Correlation analysis between ant species richness, functional traits indices and environmental variables. * means α = 0.05 level, ** means α = 0.01 level, *** means α < 0.01 level. The dotted-dashed line indicates 95% confidence interval. BC: bare ground cover; LC: leaf-litter cover; LT: leaf-litter thickness; PC: plant cover.