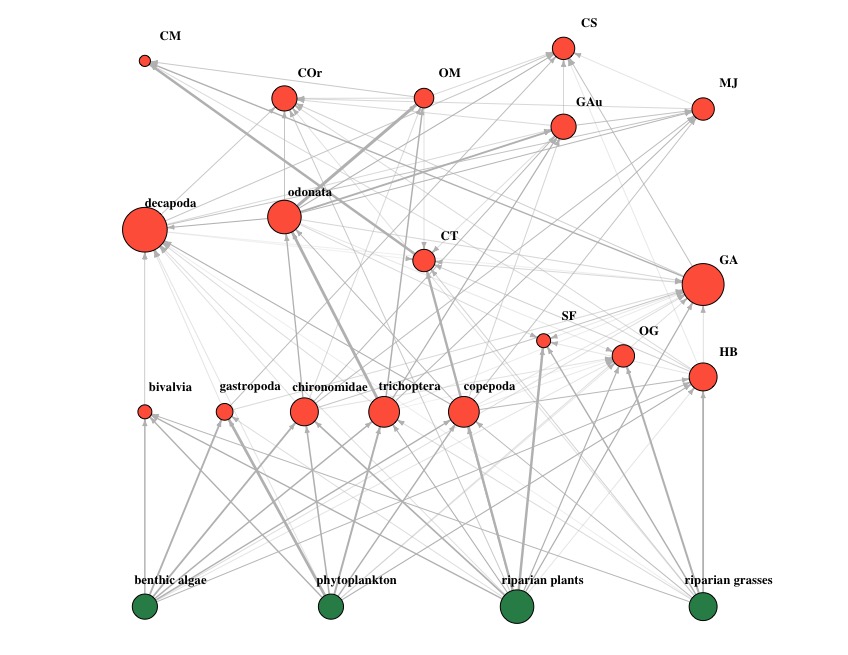
Food web diagram for Reservoir 6. Created from stable isotope data, using the code in Suppl. material
|
|
||
|
Food web diagram for Reservoir 6. Created from stable isotope data, using the code in Suppl. material |
||
| Part of: Wilkinson C, Lim RBH, Liew JH, Kwik JTB, Tan CLY, Heok Hui T, Yeo DCJ (2022) Empirical food webs of 12 tropical reservoirs in Singapore. Biodiversity Data Journal 10: e86192. https://doi.org/10.3897/BDJ.10.e86192 |