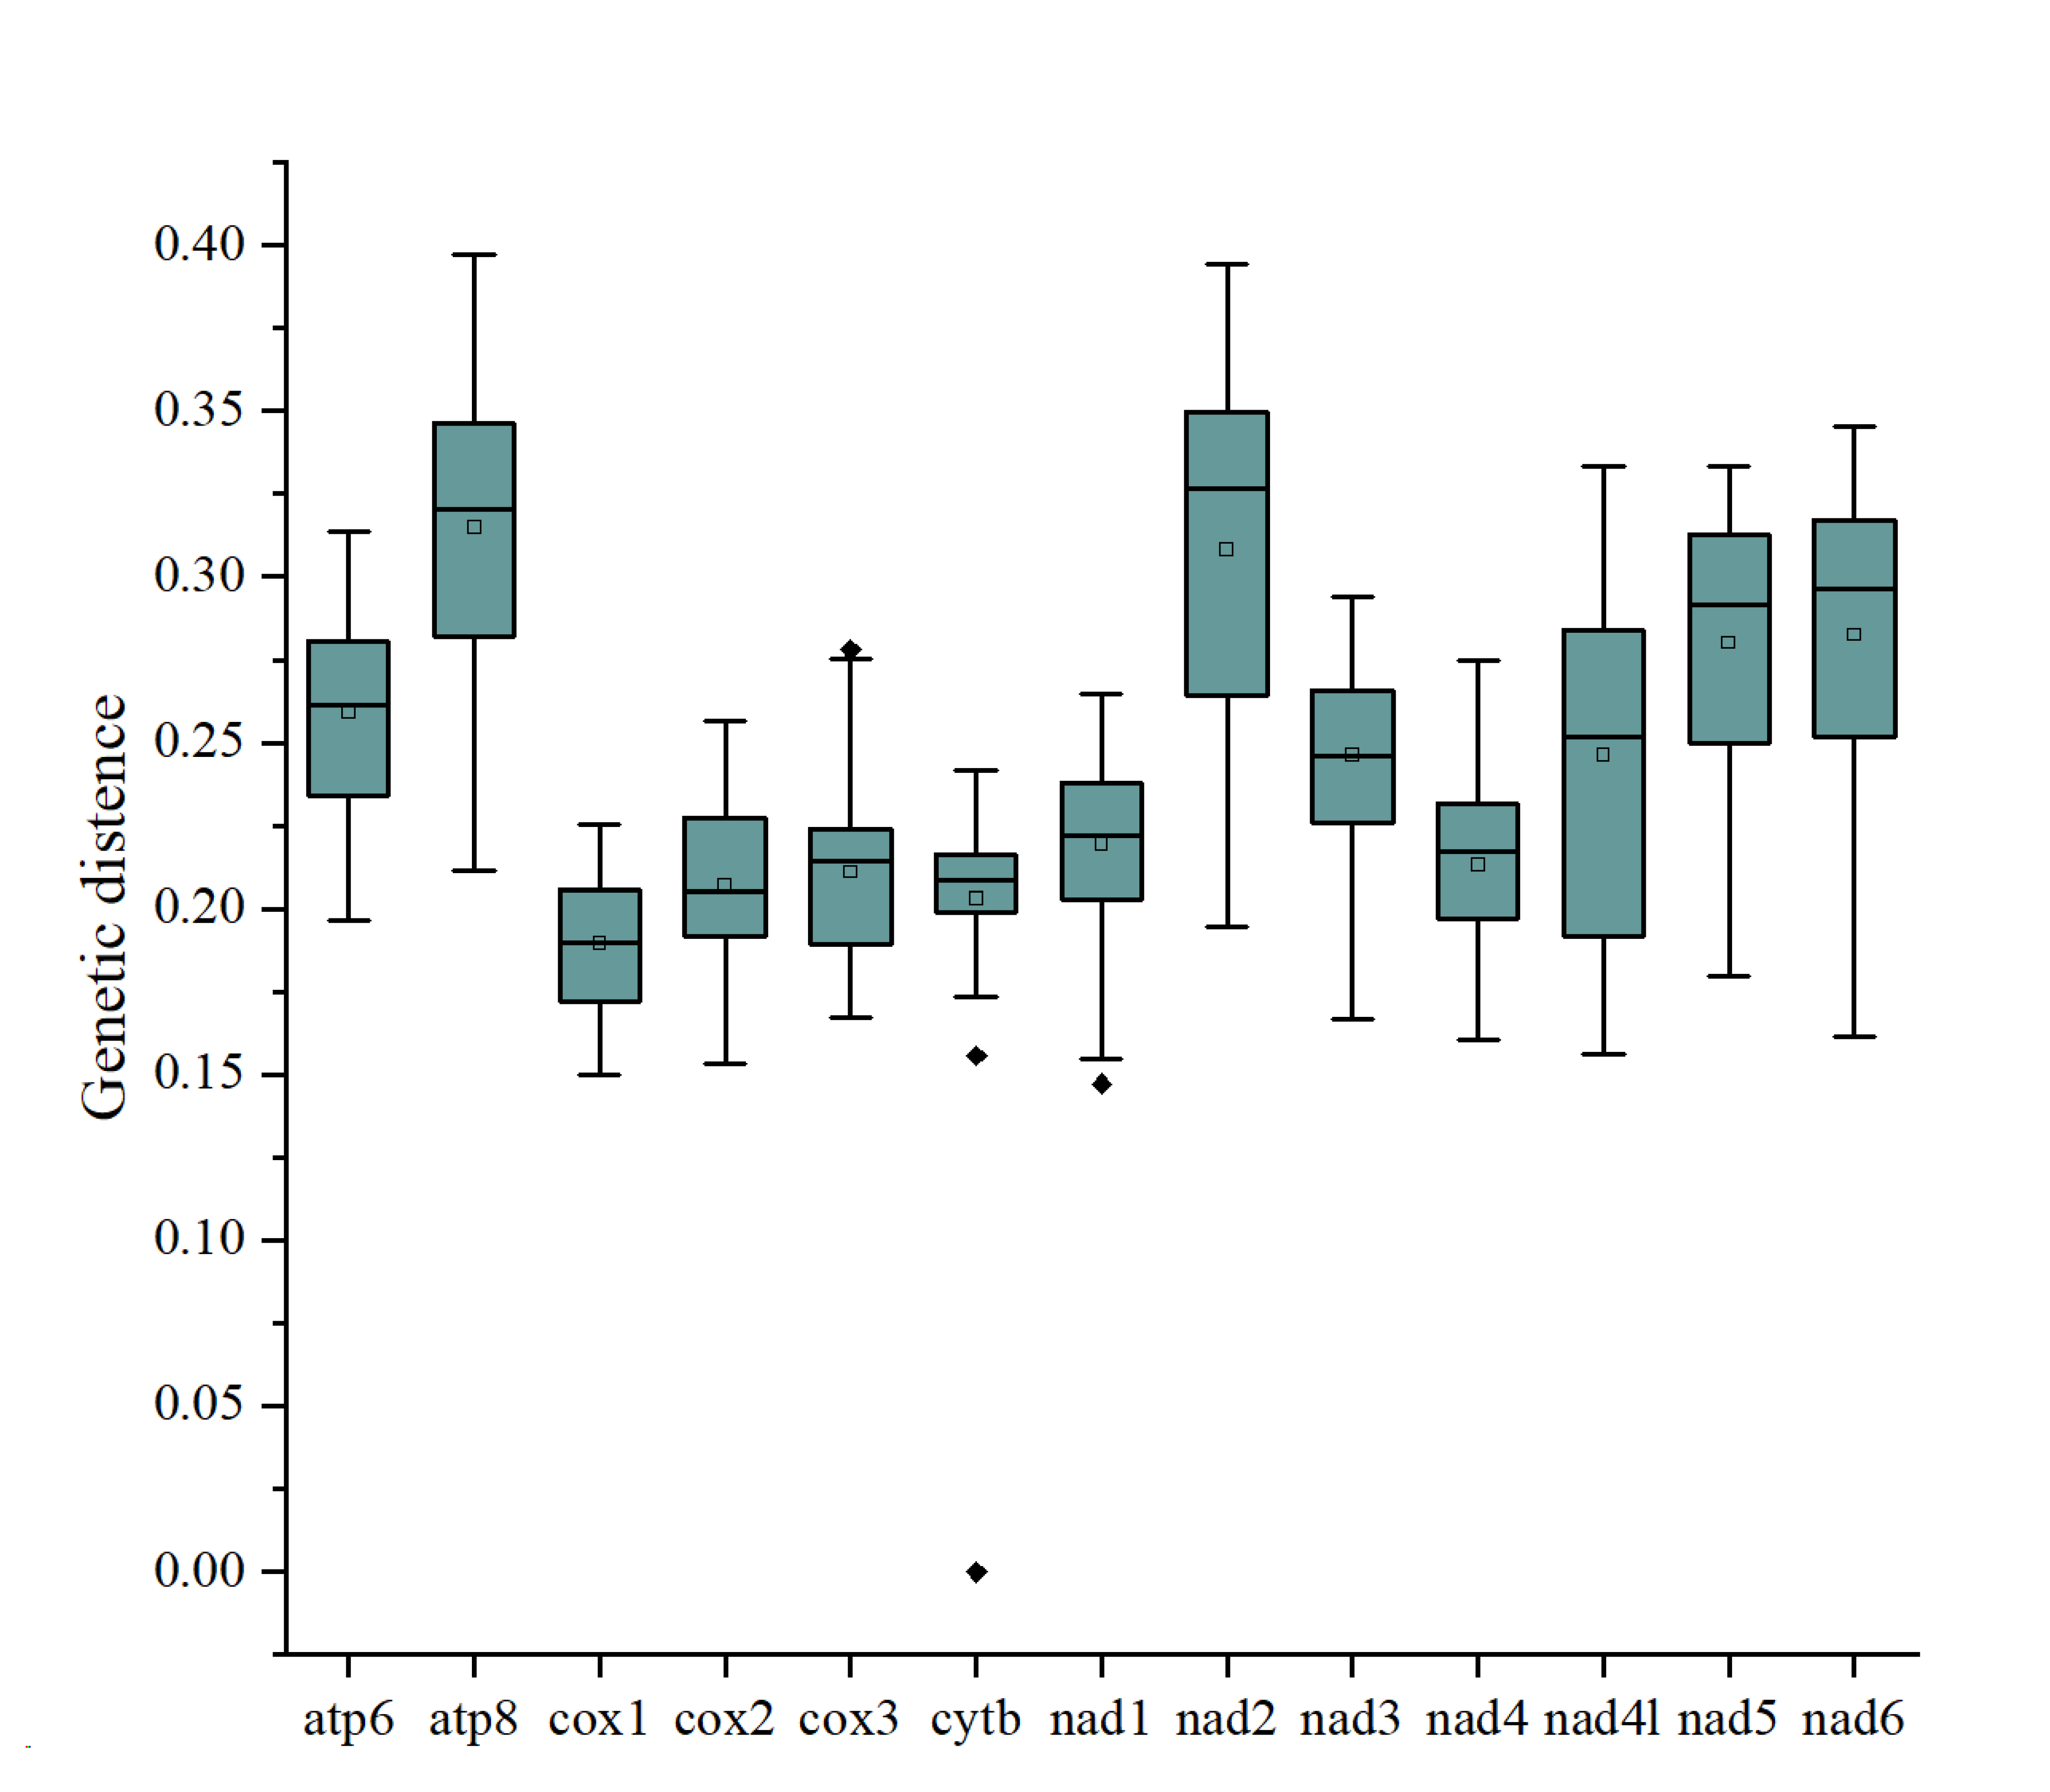
Genetic distances amongst individual PCGs. Each boxplot represents the P-distance for 13 individual genes in eleven species in Curculionidae. The box plot presents the minimum and maximum values at the ends of the whiskers, the 25th and 75th percentiles at the ends of a box, the median as a horizontal line in the box at the 50th percentile value, hollow square represent the average and solid diamond as outliers.